
Human Population Genetics and Genomics ISSN 2770-5005
Human Population Genetics and Genomics 2025;5(4):0007 | https://doi.org/10.47248/hpgg2505040007
Review Open Access
Best practices and pitfalls in using hmmix for reference-free detection of introgressed sequences
Moisès Coll Macià
1

 ,
Laurits Skov
2
,
Laurits Skov
2
Correspondence: Moisès Coll Macià; Laurits Skov
Academic Editor(s): Joshua Akey, Carina Schlebusch, Torsten Günther
Received: Aug 19, 2025 | Accepted: Nov 6, 2025 | Published: Nov 18, 2025
© 2025 by the author(s). This is an Open Access article distributed under the terms of the Creative Commons License Attribution 4.0 International (CC BY 4.0), which permits unrestricted use, distribution, and reproduction in any medium or format, provided the original work is correctly credited.
Cite this article: Coll Macià M, Skov L. Best practices and pitfalls in using hmmix for reference-free detection of introgressed sequences. Hum Popul Genet Genom. 2025;5(4):0007. https://doi.org/10.47248/hpgg2505040007
Archaic introgression from Neanderthals and Denisovans has contributed to the genomes of present-day humans, impacting traits such as our immune system. Most methods for detecting archaic ancestry rely on sequenced archaic reference genomes, which limits the detection of ancestry from unsampled or highly diverged archaic populations. Here, we discuss hmmix, a hidden Markov model–based method that infers introgressed genomic segments without requiring archaic reference data, but assumes the availability of an introgression-free outgroup population. We give a brief overview of hmmix; how it works, how to run it and which precomputed resources are available. We also discuss its imitations and recommendations on when and when not to use it and how to run it on species other than humans.
Keywordshmmix, archaic introgression, Neanderthals, Denisovans, admixture, human history, population genetics
Sequencing of the Neanderthal genomes [1] revealed that Neanderthals contributed to around 2% of the genomes of present-day humans with non-African ancestry [2,3]. The discovery and subsequent sequencing of another archaic human group [4,5], called the Denisovans, revealed that they too contributed to present-day human genome pool, with around 0.1% to Eurasian populations and 2-3% to people from Papua New Guinea [6]. Both Neanderthal and Denisovan DNA have impacted many human traits, including health, particularly the immune system [7-9].
Since most tools to detect archaic introgression are based on finding homologous sequences between sequenced archaic genomes and modern human samples, every time a new archaic genome is sequenced, introgression maps need to be updated [10]. Moreover, since the limited number of sequenced archaic human genomes might not represent all genetic variation from the introgressed population, the results from those methods are biased towards the sequenced archaic genomes to date.
To overcome this limitation, hmmix—pronounced h-m-m-mix—determines the archaic contribution to present-day human genomes without the need for archaic human reference genomes [11].
The method was designed for finding introgressed segments from a source population (referred to as Archaic, Figure 1) in a test/target genome (referred to as Ingroup, Figure 1). This is particularly useful when the source population is not sampled either because it is extinct, when DNA has yet to be recovered from it or the samples available are substantially diverged from the introgressed population, as is the case for Denisovan introgression. In this particular case, the sampled Denisovan genome diverged hundreds of thousands of years from the introgressed populations [12]. The method’s trade-off is to assume that we have access to a set of individuals closely related to the ingroup without introgression from the source population (referred to as Outgroup, Figure 1), that share a great proportion of variation with the ingroup. Thus, hmmix requires only genetic data from the ingroup and the outgroup populations, but no archaic reference sequence is needed (Figure 1). Even though hmmix terminology - archaic, ingroup and outgroup - refers to the archaic introgression scenario, hmmix can be used more generally to detect introgression from any donor/source population into a test/target population only if there exists an outgroup/unadmixed population.

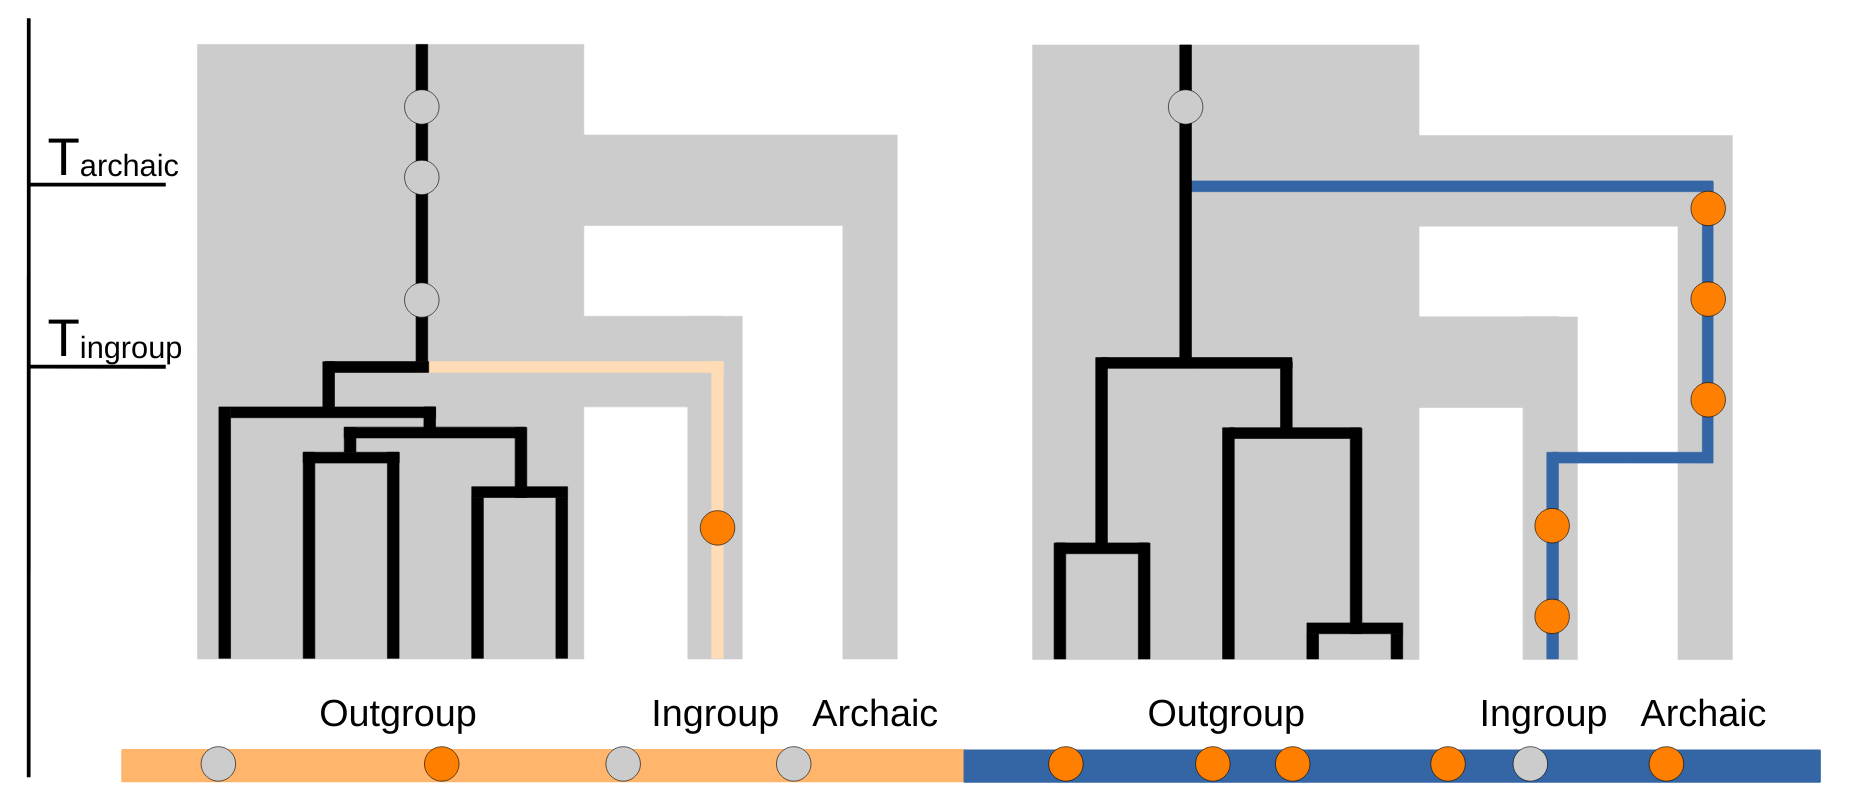
Figure 1 Overview of the method. Diagram of two gene trees for an introgressed segment (blue) and a non-introgressed segment (orange) for an ingroup individual and five outgroup individuals. When removing variants in the ingroup genome (orange and blue rectangle below) found also in the outgroup (grey) only variants private to the ingroup persist (dark orange). The difference in private variant density is how the model distinguishes ingroup segments from archaic introgressed segments.
Another advantage of the method, compared to other reference-free approaches, is that it is run independently for each ingroup genome, setting it apart from LD-based methods such as S* [13] and S’ [14]—Although we note that later versions of S* can be run on single genomes [15,16]. This allows the method to discover archaic segments independently of their frequency in the ingroup population.
To identify introgressed segments with hmmix, the method first removes the variation shared between the ingroup and the outgroup (Figure 1). Depending on the demographic history and sample size of the outgroup, this step can eliminate most of the variants that originated in their common ancestor. For instance, if the outgroup population is structured, the likelihood of identifying shared variants increases, especially when a great number of outgroup genomes are sampled. We have created a github repository (https://github.com/LauritsSkov/Determine_outgroup_size/) for the purpose of determining how much shared variation is removed depending on demography and sample size based on simulations.
The remaining SNPs in the ingroup individual are considered private SNPs. Their density, measured in genomic windows, is proportional to the minimum coalescence time with the outgroup: archaic segments show a higher SNP density than non-archaic segments because of their deeper coalescent times (Tarchaic > Tingroup, Figure 1). The power and accuracy of hmmix is high if the coalescence time between introgressed archaic segments and non-introgressed segments are very different (Tarchaic >> Tingroup).
In the context of Neanderthal introgression, the split time between present-day Sub-saharan Africans and non-Africans is estimated at around 50,000–70,000 years ago [6,17-19] while the split between modern humans and Neanderthals/Denisovans is thought to be 580,000 years ago [10]. Thus, the SNP density in the archaic state is roughly twelve times higher than the human ingroup state, which makes hmmix a good tool to infer archaic introgression in this scenario [11].
While the outgroup in hmmix is typically defined as a population free of archaic introgression—often Sub-Saharan Africans—the method is flexible. By adjusting the choice of outgroup, users can target population-specific admixture events. For instance, Denisovan introgression in Papuans can be investigated by adding any population unaffected by that specific Denisovan gene flow to the outgroup, such as European, or Asian genomes [11]. In this setup, hmmix highlights archaic components private to Papuans relative to the chosen outgroup. However, not all archaic content found with this method corresponds to the Papuan-specific Denisovan admixture. Any Neanderthal ancestry private to Papuans, when absent from the outgroup either due to genetic drift or other factors, would also be included in the inferred archaic component found with this method.
Initially, the emission parameters and transition parameters between states are not known and have to be learned from the data using hmmix’s EM optimization (Baum–Welch training). Once the parameters are optimized, the user can identify the location of archaic segments with the decoding methods provided by hmmix. The model also takes local mutation rate and genomic callability into account in its parametrization. Finally, the classification of archaic segments can be done post-processing by comparing the segments to sequenced archaic genomes.
Another feature of the hmmix framework is that the trained HMM parameters have biological interpretations: The HMM emission parameters are proportional to the coalescence times with the outgroup (Tarchaic and Tingroup) and the HMM transition parameters relate to the admixture proportion and admixture time [11].
An in-depth tutorial on how to use hmmix is hosted on github: https://github.com/LauritsSkov/Introgression-detection/.
This tutorial covers in depth the following points and it uses an individual from the publicly available 1000 genomes project as an example. The output at each step is shown and available so the user can verify that hmmix is working correctly.
To run hmmix the user needs to provide a variation file (VCF format) for the ingroup and outgroup individuals, which parts of the species reference genome can be confidently called (usually referred to as callability or accessibility file, BED format) and the reference and ancestral genome (FASTA format, although this file is optional).
For analysis of human genomes, we provide pre-computed outgroup files (using 490 individuals from 1000 genomes and HGDP), reference genomes, ancestral files and callability files for both hg19 and hg38 assemblies, which makes any non-African genome ready to analyse (resources can be found on https://doi.org/10.5281/zenodo.11212339). If the user is working with any other species than humans, they need to obtain the homologous files for their species in the same format.
Once the initial input files are obtained,
In this step,
In this step,
Given the parameter file and the observations,
The output is provided in BED format, listing the genomic segments identified and their assigned state (e.g., Archaic or Human). Each segment is accompanied by statistics such as mean posterior probability and number of genetic variants, which can be used for filtering and quality control. Because there is no universal gold standard for filtering introgressed segments, thresholds depend on the application. In studies of archaic introgression into humans, for example, posterior probability cutoffs of 0.8 [11] or 0.9 [22] have been applied, and segments have also been required to share at least one derived variant with an archaic reference genome [6].
Additionally, if a VCF file containing archaic genomes is supplied (e.g., archaic genomes in the modern human–archaic human case), hmmix annotates each segment with the number of variants it shares with each reference genome. These statistics can then be used to help classify the origin of the segments and also quality control. This annotation step is performed after archaic segments have been inferred and does not affect the initial discovery of introgressed sequences.
hmmix allows the user to work with phased data - even with other ploidities than diploid! Note that the HMM parameters should be trained separately for diploid and haploid data.
So far, the method has been used to infer archaic ancestry in 27,566 people from Iceland [22] and 1000 genomes, HGDP and ~2,700 individuals from India [6]. It has also been used for detecting introgression into other species than humans, such as mammoths [23], cattle [24], gorillas [25], bonobos [26], canids [27], killer whales [28] and bottlenose dolphins [29].
Here, we discuss issues arising from the underlying demography of the target populations. We assume that variants can be whole genome genotyped accurately. Any technical issue in this regard, would limit the performance of the method. In general, sequencing errors would decrease the power of the tool, making SNP density more similar between archaic and non-archaic states. Additionally, sparse data such as low coverage data (e.g, aDNA) or array genotyping treated without proper care leads to inaccurate segment calls with fragmented segments and increased false negative rate. For the aDNA case, we recommend using tools specifically conceived for this purpose [30].
hmmix makes multiple assumptions about the demography of the analyzed groups (Figure 2a). If these assumptions are not met, hmmix is not advised to be used. First, hmmix is not able to detect archaic introgression present in both the ingroup and outgroup population (Figure 2b). This is because these segments are removed when shared variation with the outgroup is filtered out from the ingroup genome. If you suspect that kind of introgression in your system, it is advised to use an approach that does not require genomes from the unadmixed outgroup such as ARGweaver-D [31] or ArchIE [32], both requiring instead prior knowledge about the underlying demographic model. Alternatively, you can use other models that do not rely on an unadmixed outgroup but do use archaic reference genomes instead, such as IBDmix [33].
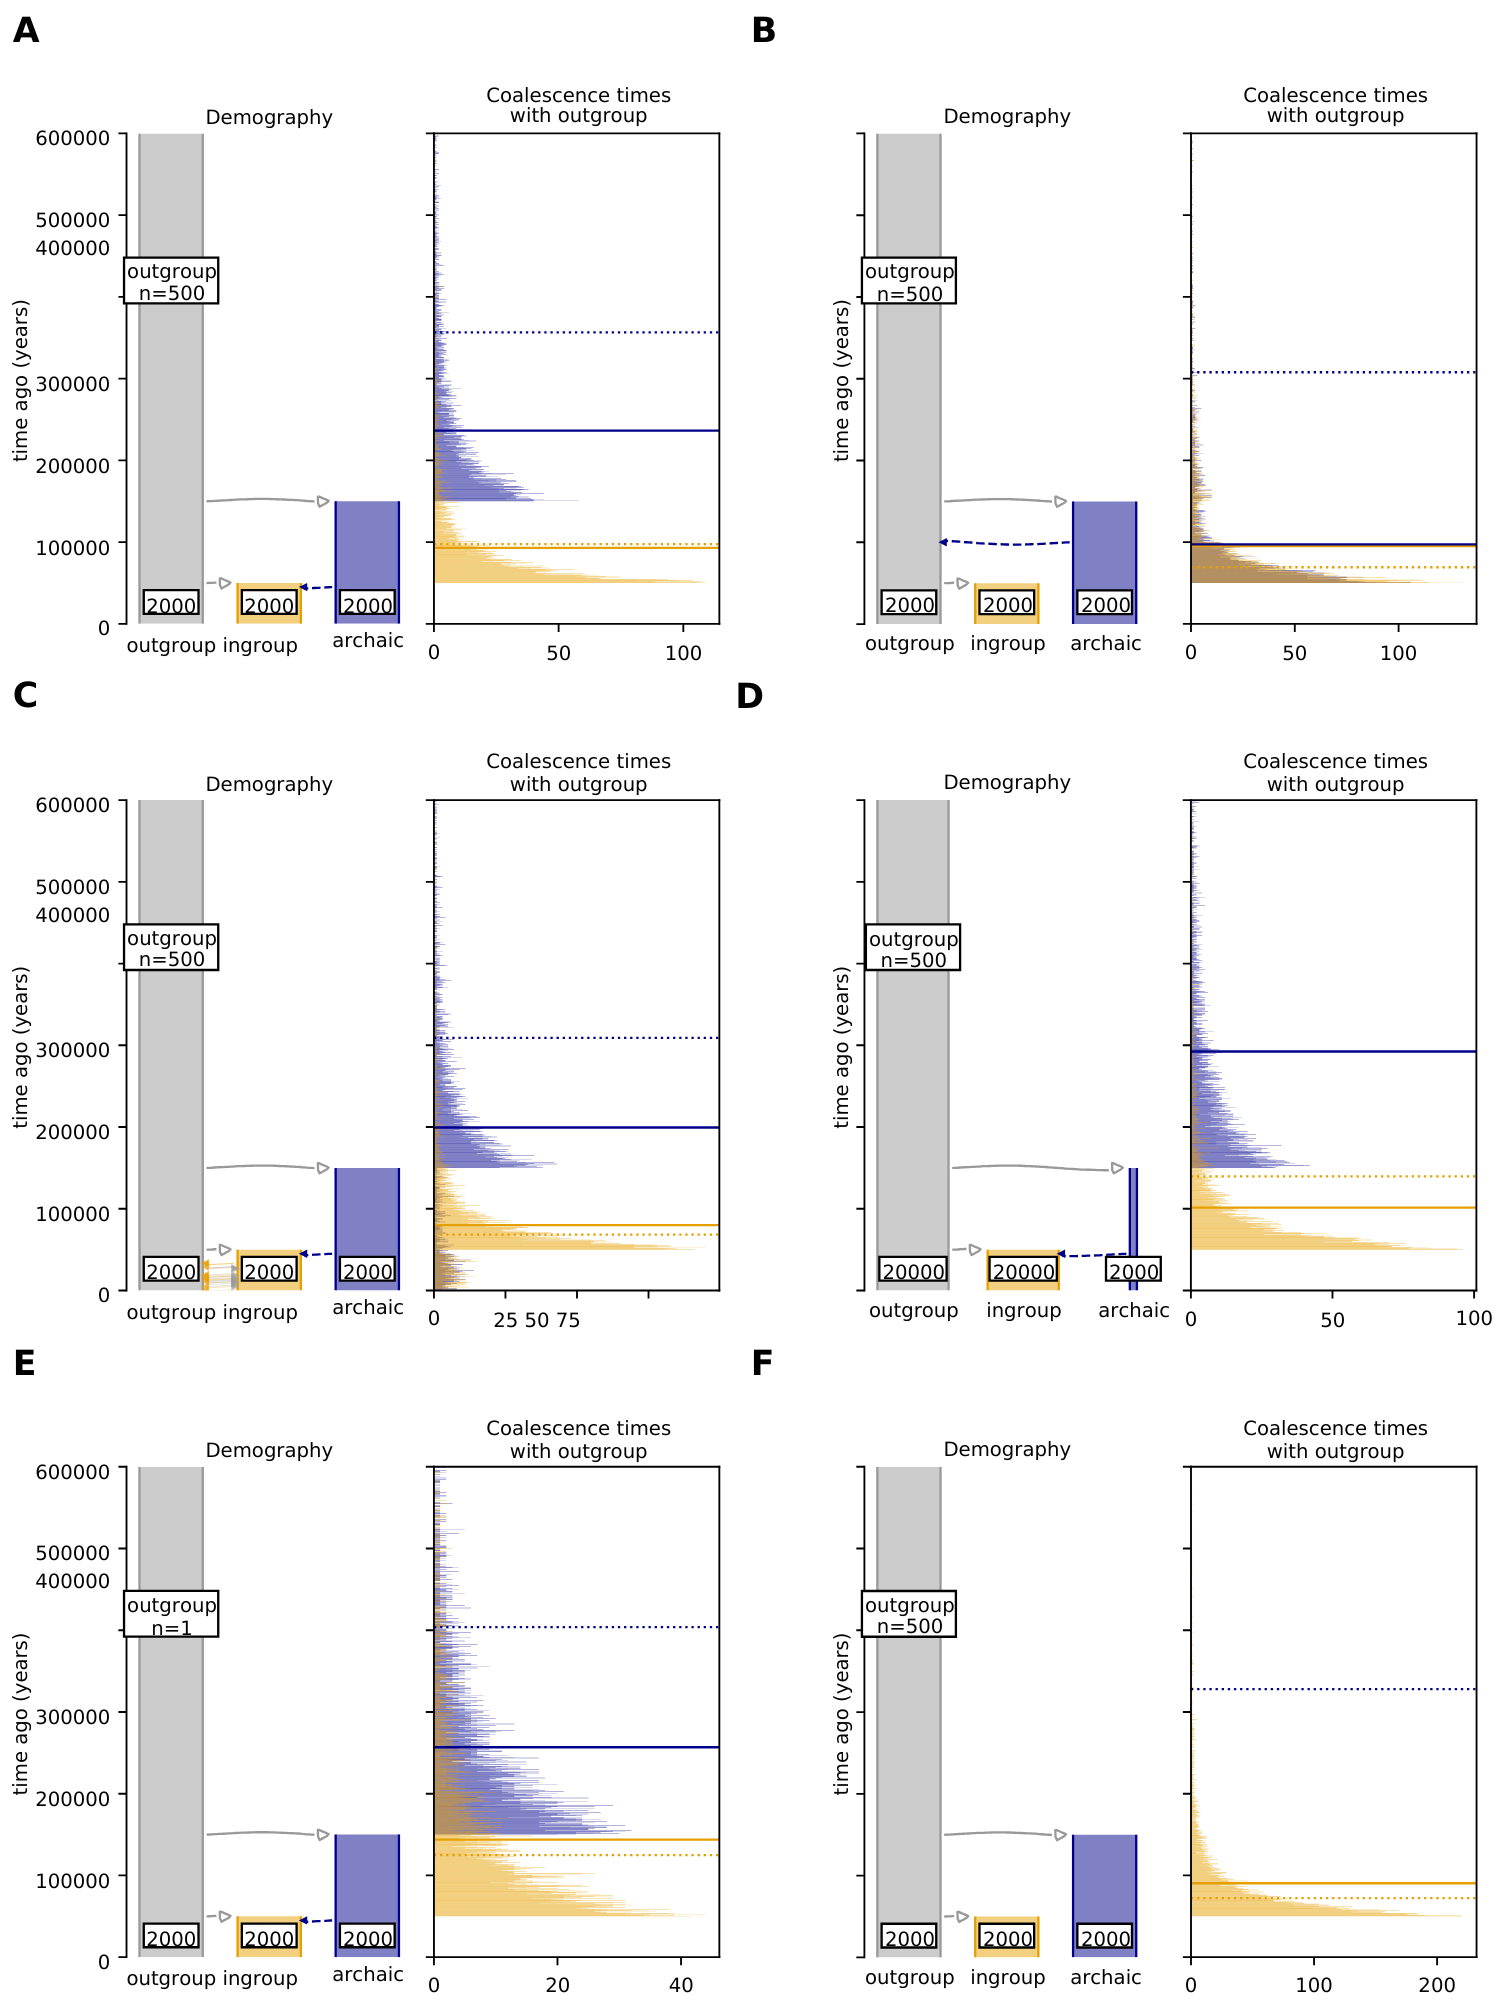
Figure 2 How demography and outgroup size changes coalescence times for archaic and ingroup states. In all panels, the msprime [34] simulated demography and the resulting distribution of true coalescence times for the ingroup state (orange) and archaic state (blue) are shown. Note this demography does NOT correspond to neanderthal/human introgression but is chosen for illustrative purposes. The y-axis is shared for the demography illustration and the coalescence time distribution plot. All panels are truncated at 600 thousand years ago. If the coalescence time distributions are very distinct, hmmix classifies introgressed segments more accurately. Each panel shows 10,000 simulated segments (50kb long) without recombination using msprime. The split time between ingroup and outgroup is 50,000 years ago and the split between archaic and outgroup is 150,000 years ago. The effective population size of all population size is shown for each population at the bottom. The dotted horizontal lines indicate the estimated emission parameter for the ingroup (orange) and archaic (blue) state by hmmix after Baum-Welsch training. The solid lines represent the mean true simulated coalescence time for each state. (a) Representation of the base-line scenario used for comparison with other scenarios. (b) introgression into the common ancestor of the ingroup and outgroup is added. (c) Geneflow between the ingroup and outgroup is added in the model, leading to many introgressed archaic segments also being present in the outgroup. (d) The effective population size of ingroup and outgroup are increased to 20k while the archaic population is kept at 2k. This increases the coalescence times especially for the archaic/outgroup state which is 856 thousand years ago. (e) The number of individuals available from the outgroup is 1, which leads to a greater overlap of coalescence times for archaic and non-archaic segments. (f) No gene flow from archaic to ingroup is simulated here. hmmix still attempts to fit two states. Note there are two inferred states (two dotted horizontal lines) even though there is only one true state.
Second, it assumes that there is none or limited geneflow in the direction ingroup > outgroup. This kind of introgression transfers archaic variation into the outgroup, which leads to a similar scenario as the one above (Figure 2c). There is evidence that back migrations from non-African populations to Africa likely masked introgressed Neanderthal segments in non-Africans [33], but not to an extent that archaic introgressed segments are completely removed. This effect can be reduced by selecting outgroup individuals with limited evidence of admixture with the ingroup population. Geneflow from outgroup > ingroup is not a concern as this only lowers Tingroup while keeping the same Tarchaic, thus not affecting the inference of archaic segments in the ingroup.
Third, the model increases its power when the distributions of coalescence times with the outgroup are sufficiently different between introgressed and non-introgressed states. In scenarios where the archaic population splits off soon before the split of the ingroup/outgroup population (Tarchaic ~ Tingroup), hmmix has trouble finding the correct archaic segments. It is also not possible if we are unable to remove enough variation that happened in the common ancestral population between ingroup and outgroup. This could be the case when there is a very large ingroup and outgroup ancestral population (Figure 2d) or a low number of samples from the outgroup are available (Figure 2e).
The demographic history of the outgroup also affects how much common variation can be removed from the ingroup. Scenarios in which outgroup lineages are prevented from coalescing within the outgroup, increase the change of coalescence with the ingroup in the common ancestor of ingroup/outgroup, which translates to more variants shared between ingroup and outgroup. Rapid coalescence in the common ancestor of ingroup/outgroup increases the contrast between Tarchaic and Tingroup. Overall, it is ideal if the outgroup population is large and structured and the common ancestor of ingroup/outgroup has a small population size.
Lastly, the coalescence times between ingroup and outgroup do not happen at the same time point, as hmmix assumes, but instead are distributed across time—exponentially distributed in a neutral scenario -, making some coalescences much older than the mean (Figure 2f). In general, this is not a problem for hmmix and can only create a few false positives. However, in the absence of introgression, hmmix always fits two emission parameters, or as many as the user defines, corresponding to each hidden state (archaic human and modern human) from the continuous distribution of coalescences, i.e. overfitting the data (Figure 2f). Currently, there is no guideline to check if the ingroup has introgression or not as hmmix is not a formal test of admixture, rather it splits the genome into how many states the user defines and infers their emission parameters.
One way to test if these states are biologically meaningful is to perform computer simulations under multiple demographies and compare the emission and transition parameters obtained after the training stage. One should also investigate the length distribution of decoded segments - false positive segments which are due to deep coalescence within the common ancestor of the ingroup and outgroup tend to be short due to recombination.
Alternatively, other genome-wide tests can be performed in advance such as f3 or f4 statistics. We stress the importance of this step as one might otherwise mistakenly infer that there is introgression from an unsampled population. We refer to this review on methods for inferring introgression [35].
To allow users of hmmix to easily simulate data from a chosen demography we make a github repository available with the code to run the above examples and encourage users to play with the different parameters to test how the coalescence time distributions differ for a specific demography that is relevant for the tested population (https://github.com/LauritsSkov/SimulateDemography/).
hmmix is a powerful tool to detect introgression without a reference genome of the introgressing population on a demography similar to the modern and archaic human admixture scenario. hmmix is being maintained and new features are still being added. We recently updated the tool with two new modules, enabling it to perform hybrid decoding and sampling hidden state sequences from the posterior probabilities [20,21]. In conclusion, hmmix has been successfully used for 8 years and as more genomes from different species become available we anticipate that it will continue to be of use to find introgression in the future.
Not applicable
Not applicable
All code used for this manuscript is available in different git hub repositories. Detailed tutorial for the use of hmmix softwer can be found in https://github.com/LauritsSkov/Introgression-detection/. To perform simulations to investigate the outgroup sample size can be found in https://github.com/LauritsSkov/Determine_outgroup_size/. The code to reproduce Figure 2 or investigate other demographic scenarios in a similar maner can be found in https://github.com/LauritsSkov/SimulateDemography/.
Moisès Coll Macià is funded by the Carlsberg Foundation, grant CF24-0447 and Laurits Skov is funded by Novonordisk grant Hallas-Møller Emerging Investigator, application number 0081723.
The authors have declared that no competing interests exists.
We acknowledge Asger Hobolt for discussing how demography and outgroup sample size affects hmmix performance.
| 1. | Green RE, Krause J, Briggs AW, Maricic T, Stenzel U, Kircher M, et al. A draft sequence of the Neandertal genome. Science. 2010;328(5979):710-722. [Google Scholar] [CrossRef] |
| 2. | Vernot B, Akey JM. Resurrecting surviving Neandertal lineages from modern human genomes. Science. 2014;343(6174):1017-1021. [Google Scholar] [CrossRef] |
| 3. | Sankararaman S, Mallick S, Dannemann M, Prüfer K, Kelso J, Pääbo S, et al. The genomic landscape of Neanderthal ancestry in present-day humans. Nature. 2014;507(7492):354-357. [Google Scholar] [CrossRef] |
| 4. | Meyer M, Kircher M, Gansauge M-T, Li H, Racimo F, Mallick S, et al. A high-coverage genome sequence from an archaic Denisovan individual. Science. 2012;338(6104):222-226. [Google Scholar] [CrossRef] |
| 5. | Reich D, Green RE, Kircher M, Krause J, Patterson N, Durand EY, et al. Genetic history of an archaic hominin group from Denisova Cave in Siberia. Nature. 2010;468(7327):1053-1060. [Google Scholar] [CrossRef] |
| 6. | Kerdoncuff E, Skov L, Patterson N, Banerjee J, Khobragade P, Chakrabarti SS, et al. 50,000 years of evolutionary history of India: Impact on health and disease variation. Cell. 2025;188(13):3389-3404.e3386. [Google Scholar] [CrossRef] |
| 7. | Dannemann M, Andrés AM, Kelso J. Introgression of Neandertal- and Denisovan-like haplotypes contributes to adaptive variation in human toll-like receptors. Am J Hum Genet. 2016;98(1):22-33. [Google Scholar] [CrossRef] |
| 8. | Quach H, Rotival M, Pothlichet J, Loh Y-HE, Dannemann M, Zidane N, et al. Genetic adaptation and neandertal admixture shaped the immune system of human populations. Cell. 2016;167(3):643-656. e617. [Google Scholar] [CrossRef] |
| 9. | Jagoda E, Xue JR, Reilly SK, Dannemann M, Racimo F, Huerta-Sanchez E, et al. Detection of Neanderthal adaptively introgressed genetic variants that modulate reporter gene expression in human immune cells. Mol Biol Evol. 2022;39(1):msab304. [Google Scholar] [CrossRef] |
| 10. | Prüfer K, De Filippo C, Grote S, Mafessoni F, Korlević P, Hajdinjak M, et al. A high-coverage Neandertal genome from Vindija Cave in Croatia. Science. 2017;358(6363):655-658. [Google Scholar] [CrossRef] |
| 11. | Skov L, Hui R, Shchur V, Hobolth A, Scally A, Schierup MH, et al. Detecting archaic introgression using an unadmixed outgroup. PLoS Genet. 2018;14(9):e1007641. [Google Scholar] [CrossRef] |
| 12. | Prüfer K, Racimo F, Patterson N, Jay F, Sankararaman S, Sawyer S, et al. The complete genome sequence of a Neanderthal from the Altai Mountains. Nature. 2014;505(7481):43-49. [Google Scholar] [CrossRef] |
| 13. | Plagnol V, Wall JD. Possible ancestral structure in human populations. PLoS Genet. 2006;2(7):e105. [Google Scholar] [CrossRef] |
| 14. | Browning SR, Browning BL, Zhou Y, Tucci S, Akey JM. Analysis of human sequence data reveals two pulses of archaic Denisovan admixture. Cell. 2018;173(1):53-61. e59. [Google Scholar] [CrossRef] |
| 15. | Vernot B, Tucci S, Kelso J, Schraiber JG, Wolf AB, Gittelman RM, et al. Excavating Neandertal and Denisovan DNA from the genomes of Melanesian individuals. Science. 2016;352(6282):235-239. [Google Scholar] [CrossRef] |
| 16. | Huang X, Kruisz P, Kuhlwilm M. sstar: A Python package for detecting archaic introgression from population genetic data with S. Mol Biol Evol. 2022;39(11):msac212. [Google Scholar] [CrossRef] |
| 17. | Malaspinas A-S, Westaway MC, Muller C, Sousa VC, Lao O, Alves I, et al. A genomic history of Aboriginal Australia. Nature. 2016;538(7624):207-214. [Google Scholar] [CrossRef] |
| 18. | Mallick S, Li H, Lipson M, Mathieson I, Gymrek M, Racimo F, et al. The Simons genome diversity project: 300 genomes from 142 diverse populations. Nature. 2016;538(7624):201-206. [Google Scholar] [CrossRef] |
| 19. | Pagani L, Lawson DJ, Jagoda E, Mörseburg A, Eriksson A, Mitt M, et al. Genomic analyses inform on migration events during the peopling of Eurasia. Nature. 2016;538(7624):238-242. [Google Scholar] [CrossRef] |
| 20. | Coll Macià M, Skov L, Damgaard Bæk ZE, Hobolth A. Enhancement of hidden Markov model analyses for improved inference of archaic introgression in modern humans. bioRxiv. 2025. [Google Scholar] [CrossRef] |
| 21. | Bæk ZED, Coll Macià M, Skov L, Hobolth A. Advanced posterior analyses of hidden Markov models: finite Markov chain imbedding and hybrid decoding. arXiv preprint. 2025;arXiv:250415156. [Google Scholar] [CrossRef] |
| 22. | Skov L, Coll Macià M, Sveinbjörnsson G, Mafessoni F, Lucotte EA, Einarsdóttir MS, et al. The nature of Neanderthal introgression revealed by 27,566 Icelandic genomes. Nature. 2020;582(7810):78-83. [Google Scholar] [CrossRef] |
| 23. | Van Der Valk T, Pečnerová P, Díez-del-Molino D, Bergström A, Oppenheimer J, Hartmann S, et al. Million-year-old DNA sheds light on the genomic history of mammoths. Nature. 2021;591(7849):265-269. [Google Scholar] [CrossRef] |
| 24. | Dai X, Bian P, Hu D, Luo F, Huang Y, Jiao S, et al. A Chinese indicine pangenome reveals a wealth of novel structural variants introgressed from other Bos species. Genome Res. 2023;33(8):1284-1298. [Google Scholar] [CrossRef] |
| 25. | Pawar H, Rymbekova A, Cuadros-Espinoza S, Huang X, De Manuel M, Van der Valk T, et al. Ghost admixture in eastern gorillas. Nat Ecol Evol. 2023;7(9):1503-1514. [Google Scholar] [CrossRef] |
| 26. | Kuhlwilm M, Han S, Sousa VC, Excoffier L, Marques-Bonet T. Ancient admixture from an extinct ape lineage into bonobos. Nat Ecol Evol. 2019;3(6):957-965. [Google Scholar] [CrossRef] |
| 27. | Wang M-S, Wang S, Li Y, Jhala Y, Thakur M, Otecko NO, et al. Ancient hybridization with an unknown population facilitated high-altitude adaptation of canids. Mol Biol Evol. 2020;37(9):2616-2629. [Google Scholar] [CrossRef] |
| 28. | Foote AD, Martin MD, Louis M, Pacheco G, Robertson KM, Sinding MHS, et al. Killer whale genomes reveal a complex history of recurrent admixture and vicariance. Mol Ecol. 2019;28(14):3427-3444. [Google Scholar] [CrossRef] |
| 29. | Louis M, Galimberti M, Archer F, Berrow S, Brownlow A, Fallon R, et al. Selection on ancestral genetic variation fuels repeated ecotype formation in bottlenose dolphins. Sci Adv. 2021;7(44):eabg1245. [Google Scholar] [CrossRef] |
| 30. | Peter BM. 100,000 years of gene flow between Neandertals and Denisovans in the Altai mountains. BioRxiv. 2020;2020-03. [Google Scholar] [CrossRef] |
| 31. | Hubisz MJ, Williams AL, Siepel A. Mapping gene flow between ancient hominins through demography-aware inference of the ancestral recombination graph. PLoS Genet. 2020;16(8):e1008895. [Google Scholar] [CrossRef] |
| 32. | Durvasula A, Sankararaman S. A statistical model for reference-free inference of archaic local ancestry. PLoS Genet. 2019;15(5):e1008175. [Google Scholar] [CrossRef] |
| 33. | Chen L, Wolf AB, Fu W, Li L, Akey JM. Identifying and interpreting apparent Neanderthal ancestry in African individuals. Cell. 2020;180(4):677-687. e616. [Google Scholar] [CrossRef] |
| 34. | Baumdicker F, Bisschop G, Goldstein D, Gower G, Ragsdale AP, Tsambos G, et al. Efficient ancestry and mutation simulation with msprime 1.0. Genetics. 2022;220(3):iyab229. [Google Scholar] [CrossRef] |
| 35. | Huang X, Hackl J, Kuhlwilm M. Decoding Genomic Landscapes of Introgression. Trends Genet. 2025;S0168-9525(25)00166-0. [Google Scholar] [CrossRef] |

![]()
Copyright © 2026 Pivot Science Publications Corp. - unless otherwise stated | Terms and Conditions | Privacy Policy


