
Human Population Genetics and Genomics ISSN 2770-5005
Human Population Genetics and Genomics 2025;5(1):0003 | https://doi.org/10.47248/hpgg2505010003
Original Research Open Access
Brahui and Oraon: Tracing the Northern Dravidian genetic link back to Balochistan
Prajjval Pratap Singh
1,2

 ,
Ajai Kumar Pathak
2,3
,
Sachin Kr. Tiwary
4
,
Shailesh Desai
1
,
Rahul Kumar Mishra
1
,
Rakesh Tamang
5
,
Vasant Shinde
6
,
Richard Villems
2
,
Toomas Kivisild
2,3
,
Mait Metspalu
2
,
George van Driem
7
,
Gazi Nurun Nahar Sultana
8
,
Gyaneshwer Chaubey
1
,
Ajai Kumar Pathak
2,3
,
Sachin Kr. Tiwary
4
,
Shailesh Desai
1
,
Rahul Kumar Mishra
1
,
Rakesh Tamang
5
,
Vasant Shinde
6
,
Richard Villems
2
,
Toomas Kivisild
2,3
,
Mait Metspalu
2
,
George van Driem
7
,
Gazi Nurun Nahar Sultana
8
,
Gyaneshwer Chaubey
1
Correspondence: Gazi Nurun Nahar Sultana; Gyaneshwer Chaubey
Academic Editor(s): Joshua Akey
Received: Dec 20, 2024 | Accepted: Feb 3, 2025 | Published: Mar 1, 2025
© 2025 by the author(s). This is an Open Access article distributed under the Creative Commons License Attribution 4.0 International (CC BY 4.0) license, which permits unrestricted use, distribution and reproduction in any medium or format, provided the original work is correctly credited.
Cite this article: Singh PP, Pathak AK, Tiwary SK, Desai S, Mishra RK, Tamang R, Shinde V, Villems R, Kivisild T, Metspalu M, van Driem G, Sultana GNN, Chaubey G. Brahui and Oraon: Tracing the Northern Dravidian genetic link back to Balochistan. Hum Popul Genet Genom 2025; 5(1):0003. https://doi.org/10.47248/hpgg2505010003
The genetic origin of ethnic groups present in South Asia is complex. Widespread factors such as complex societal caste structure, language shifts, the coexistence of tribal alongside caste populations, and a varied and vast geography augment this complexity. In the face of this complexity, a holistic approach is required for the study of population histories. The isolated Dravidian population, Brahui in Pakistan, represents a remnant of complex ethnolinguistic population history. Genetic studies conducted to date have not demonstrated a close genetic link between the Brahui and other Dravidian populations of the Indian subcontinent. However, none of these studies included the Kurukh-Malto populations, which are linguistically closest to the Brahui. In this study, we included the Kurukh speaking Oraon population and their neighbours in high-resolution genetic analyses to investigate their allele and haplotype sharing with the Brahui population of Pakistan. Our intrapopulation analyses on Oraon collected from Bangladesh and India suggested a common South Asian source for the Oraon that is genetically distinct from the extent of Indian Mundari (Austroasiatic) populations. The interpopulation comparison of Oraon showed a closer genetic affinity with the geographically more distant Mawasi (North Munda) and Gond (South Dravidian) populations, rather than their immediate neighbours. Moreover, our extensive statistical analyses found no signal of an Oraon-related ancestry in Brahui. One possible explanation to this finding is that the genetic signature related to the Dravidian populations might have been entirely lost in Brahui due to extensive admixture with neighboring populations.
KeywordsSouth Asia, Kurukh-Malto, Brahui, Dravidian, Oraon, Autosomes
Majority of the South Asians speak languages from four language families: Indo-European, Dravidian, Austroasiatic and Trans-Himalayan. Additionally, there are many language isolates such as Nihali, Vedda, Kusunda, Burushaski and the two minor language families of the Andaman Islands [1] Within the complex mosaic of linguistic diversity, the Brahui, located in what today is southwestern Pakistan, represent an apparent outlier for the geographic distribution of Dravidian-speaking populations concentrated mostly in southern India [2,3] (Figure S1).
Genetic analyses conducted to date focusing on Brahui using uniparental and biparental markers have not revealed any signal of close affinity between the Brahui and other Dravidian speakers of the Indian subcontinent [4–6]. The mitochondrial DNA (mtDNA) haplogroup composition of Brahui is mainly from West Eurasia and South Asia, with minor contributions from East Eurasian and African lineages [5]. The Y-chromosomal haplogroups R1a and J account for more than 65% of the male lineages, whereas the predominant Dravidian haplogroups e.g. H (>1%) and L, are rarely (<8%) found in Brahui [4]. Largely similar mtDNA and Y haplogroup compositions in Balochi, Mohanna and Makarani suggest extensive gene flow from these neighbouring populations to Brahui in their population history. High-resolution autosomal analyses likewise have failed to identify a close genetic affinity of the Brahui with the other Dravidian populations [6].
Notably, the Dravidian populations previously studied in quest of some common genetic sharing with the Brahui mainly involved speakers of the language of the Central and South branches of Dravidian. In contrast, Brahui belongs to the Northern branch (Figure S1). Speakers of Kurukh-Malto, who linguistically represent the branch closest to Brahui, have not previously been surveyed for high-resolution analysis. Therefore, we here revisit the question of the genetic affinity of the Brahui with new genome-scale data on the Oraon (Kurukh) population.
The Oraon constitute a large Dravidian tribe scattered throughout Jharkhand, Chhattisgarh, Bihar, West Bengal, Bangladesh and adjacent portions of Bhutan and Nepal [7,8]. In Bangladesh, the Oraon represent the second-largest tribal community and are mainly concentrated in the northwest (Figure S2). The major migration of Oraon to Bangladesh during the British Raj was initiated in 1871 as a labour in the tea gardens [9,10]. The Kurukh language spoken by the Oraon is classified within the North Dravidian branch, with which Brahui exhibits the closest genetic affinity [11,12]. Our expeditions corroborated Risley’s 19th-century report that Oraon settlements are interspersed amongst populations speaking Austroasiatic and Indo-European languages, which has engendered widespread bilingualism amongst the Oraon and even language loss (Figure S3).
The areas in India and Bangladesh where Oraon is spoken, the Indo-Aryan language Sadri and, in Bangladesh, also the Bengali dialect Sylheti are used as a lingua franca, which has led to either bilingualism or even the complete linguistic assimilation of many Oraon villages and settlements [8,13]. In Bangladesh today, nearly 25,000 out of 90,000 Oraon still speak Kurukh. Kurukh or Oraon is classified as ‘vulnerable’ in UNESCO’s list of endangered languages. The Oraon is subdivided into various clans, such as Ekka, Tigga, Barla, Kujur, Bara, Lakra, Tirkey, Bakhla, Toppo, Kispotta, Minz and Kerketta. Risley (1891) reported that the tribes Kuda and Kissan avoided intermarriage with the Oraon [7].
Many scholars have interpreted that the Brahui represent a local linguistic vestige of the Indus Civilisation, which was likely populated by a pre-Indo-European and predominantly Dravidian population [1–3,14–23].
With the novel high-resolution datasets, we have revisited the Dravidian connection of Brahui and investigated the fine-grained genetic origins of Oraon tribes and their inter-regional and intra-regional genetic affinity within the South Asian genetic landscape.
The ethical committee of the Banaras Hindu University, Varanasi, India, and the University of Dhaka, Bangladesh, approved this study. Blood samples were collected from India and Bangladesh. For our genetic analyses, 204 unrelated individuals were collected from India (Bihar, Jharkhand, Madhya Pradesh, and Odisha states), and 43 unrelated Oraon individuals from northwestern Bangladesh (Figure S2). Informed consent was explained in the local language, and signatures by thumb impression were obtained from the participants. The sampling points were populated by Oraon people (Figure S2). DNA isolation and quantification followed the standard protocol [24]. For haploid DNA analyses, mtDNA HVS-I, related coding markers, and Y chromosome markers were genotyped for these samples (Tables S1 and S2). Based on the mutational motifs, haplogroup classification was performed manually (Table S1). Y-chromosomal haplogroups were assigned based on the genotype result (Table S2).
We randomly selected ten high-quality Oraon samples from the Bangladesh collection and generated Illumina 730K genotype data. We merged these data with 1,073 published samples belonging to 84 world populations (Table S3). PLINK2 was used for data management and curation [25]. We thinned the dataset by removing one SNP of any pair in strong LD (r2 > 0.4), to obviate background linkage disequilibrium (LD) that could potentially affect both the principal component (PCA) and ADMIXTURE analyses, in a window of 200 SNPs (sliding the window by 25 SNPs at a time). After pruning, we obtained 155,692 high quality SNPs, which were used for PCA and ADMIXTURE analyses.
We also used another dataset published elsewhere carrying the Oraon population from India [26] and merged our Oraon data from Bangladesh. After merging the total number of SNPs reduced substantially (170,537), and these data were only used to ascertain the genetic relation between Oraon samples from two distinct locations. In summary, initially we used two datasets. One dataset containing the newly sampled Bangladeshi Oraon individuals was used for the whole manuscript (245,843 SNPs after merging; 155,692 SNPs after pruning) another dataset was used just to compare the genetic affinity of Oraon from Bangladesh and India (170,537 SNPs after merging).
We performed the Principal Component (PC) analysis using the smartpca programme of the EIGENSOFT package [27] with the default settings to capture genetic variability described by the components. We grouped tribal and caste populations according to their linguistic affiliation, such as Indo-European, Austroasiatic, Trans-Himalayan and Dravidian. We ran ADMIXTURE [28] with a random seed number generator on the LD-pruned data set 25 times from K=2 to K=15. The best supported clustering (K) was 14. We used PLINK2 for the Fst calculation of the target populations [25].
Given the result of the PC and ADMIXTURE analysis, we removed two outlier samples for further population-based analysis. The outgroup f3 statistics [29] were calculated as f3 = (Oraon,X;Yoruba), where X was any other population and Yoruba was used as an outgroup.
For haplotype-based analysis (fineSTRUCTURE) [30] samples phased with Beagle 3.3.2. [31] were subsequently analysed by the clustering algorithm fineSTRUCTURE to perform an MCMC iteration, using 10M burning run time and the same MCMC iterations. The data, generated through fineSTRUCTURE, were used to construct the maximum likelihood (ML) tree. The tree was constructed by using MEGA 7 programme [32]. Runs of homozygosity (RoH) were performed using PLINK2 [25], to investigate the inbreeding level and ancestral homozygous component sharing. For RoH estimation, we applied window size 1,000 kb, a minimum of 100 SNPs per window allowing one heterozygous and five missing calls per window.
We used fastGLOBETROTTER [33], a haplotype-based technique, to identify, date and describe admixture events using genome-wide autosomal data. We used in total 284 individual samples from 45 populations, where Oraon was set as target population for admixture whereas others were included as possible donors using final 100 bootstraps. We have also used ALDER [34] and MALDER [35] to understand the admixing time using multiple source populations with default settings.
We used the program ASCEND (Allele Sharing Correlation for Estimation of Nonequilibrium Demography) [36], to compute the founder date and intensity for the Brahui and Oraon. To further investigate evidence for past gene flow between the Oraon and the Brahui, we identified long shared allele intervals (LSAIs) >5cM with IBIS1 [37] and calculated the probability of individual connectedness (PiC) [38] among 81 populations from Asia.
Despite the demonstrable linguistic connection between Brahui and the other Dravidian populations, previous genetic studies failed to find a signal of more recent common ancestry between the two [4–6]. However, we note that the populations linguistically closest to the Brahui had not previously been analysed (Figure S1). Therefore, to test the genetic affinity between these linguistically related groups, we performed the Principal Component (PC) analysis to investigate the genetic relation between Brahui and Oraon (Figure 1). The Brahui are clustered with the rest of the Pakistani population, whilst the Oraon show an affinity with the Indian Austroasiatic (i.e., Mundari) cluster. Mundari speakers deviate from the South Asian cline because of the introgressed Southeast Asian related ancestry [39–42]. Together with the Mundari, some populations living nearby and speaking Indo-European and Dravidian languages also fall into the same cluster. These populations have been called ‘transitional’ populations [43]. Because of close geographical proximity, these populations have experienced reciprocal gene flow.

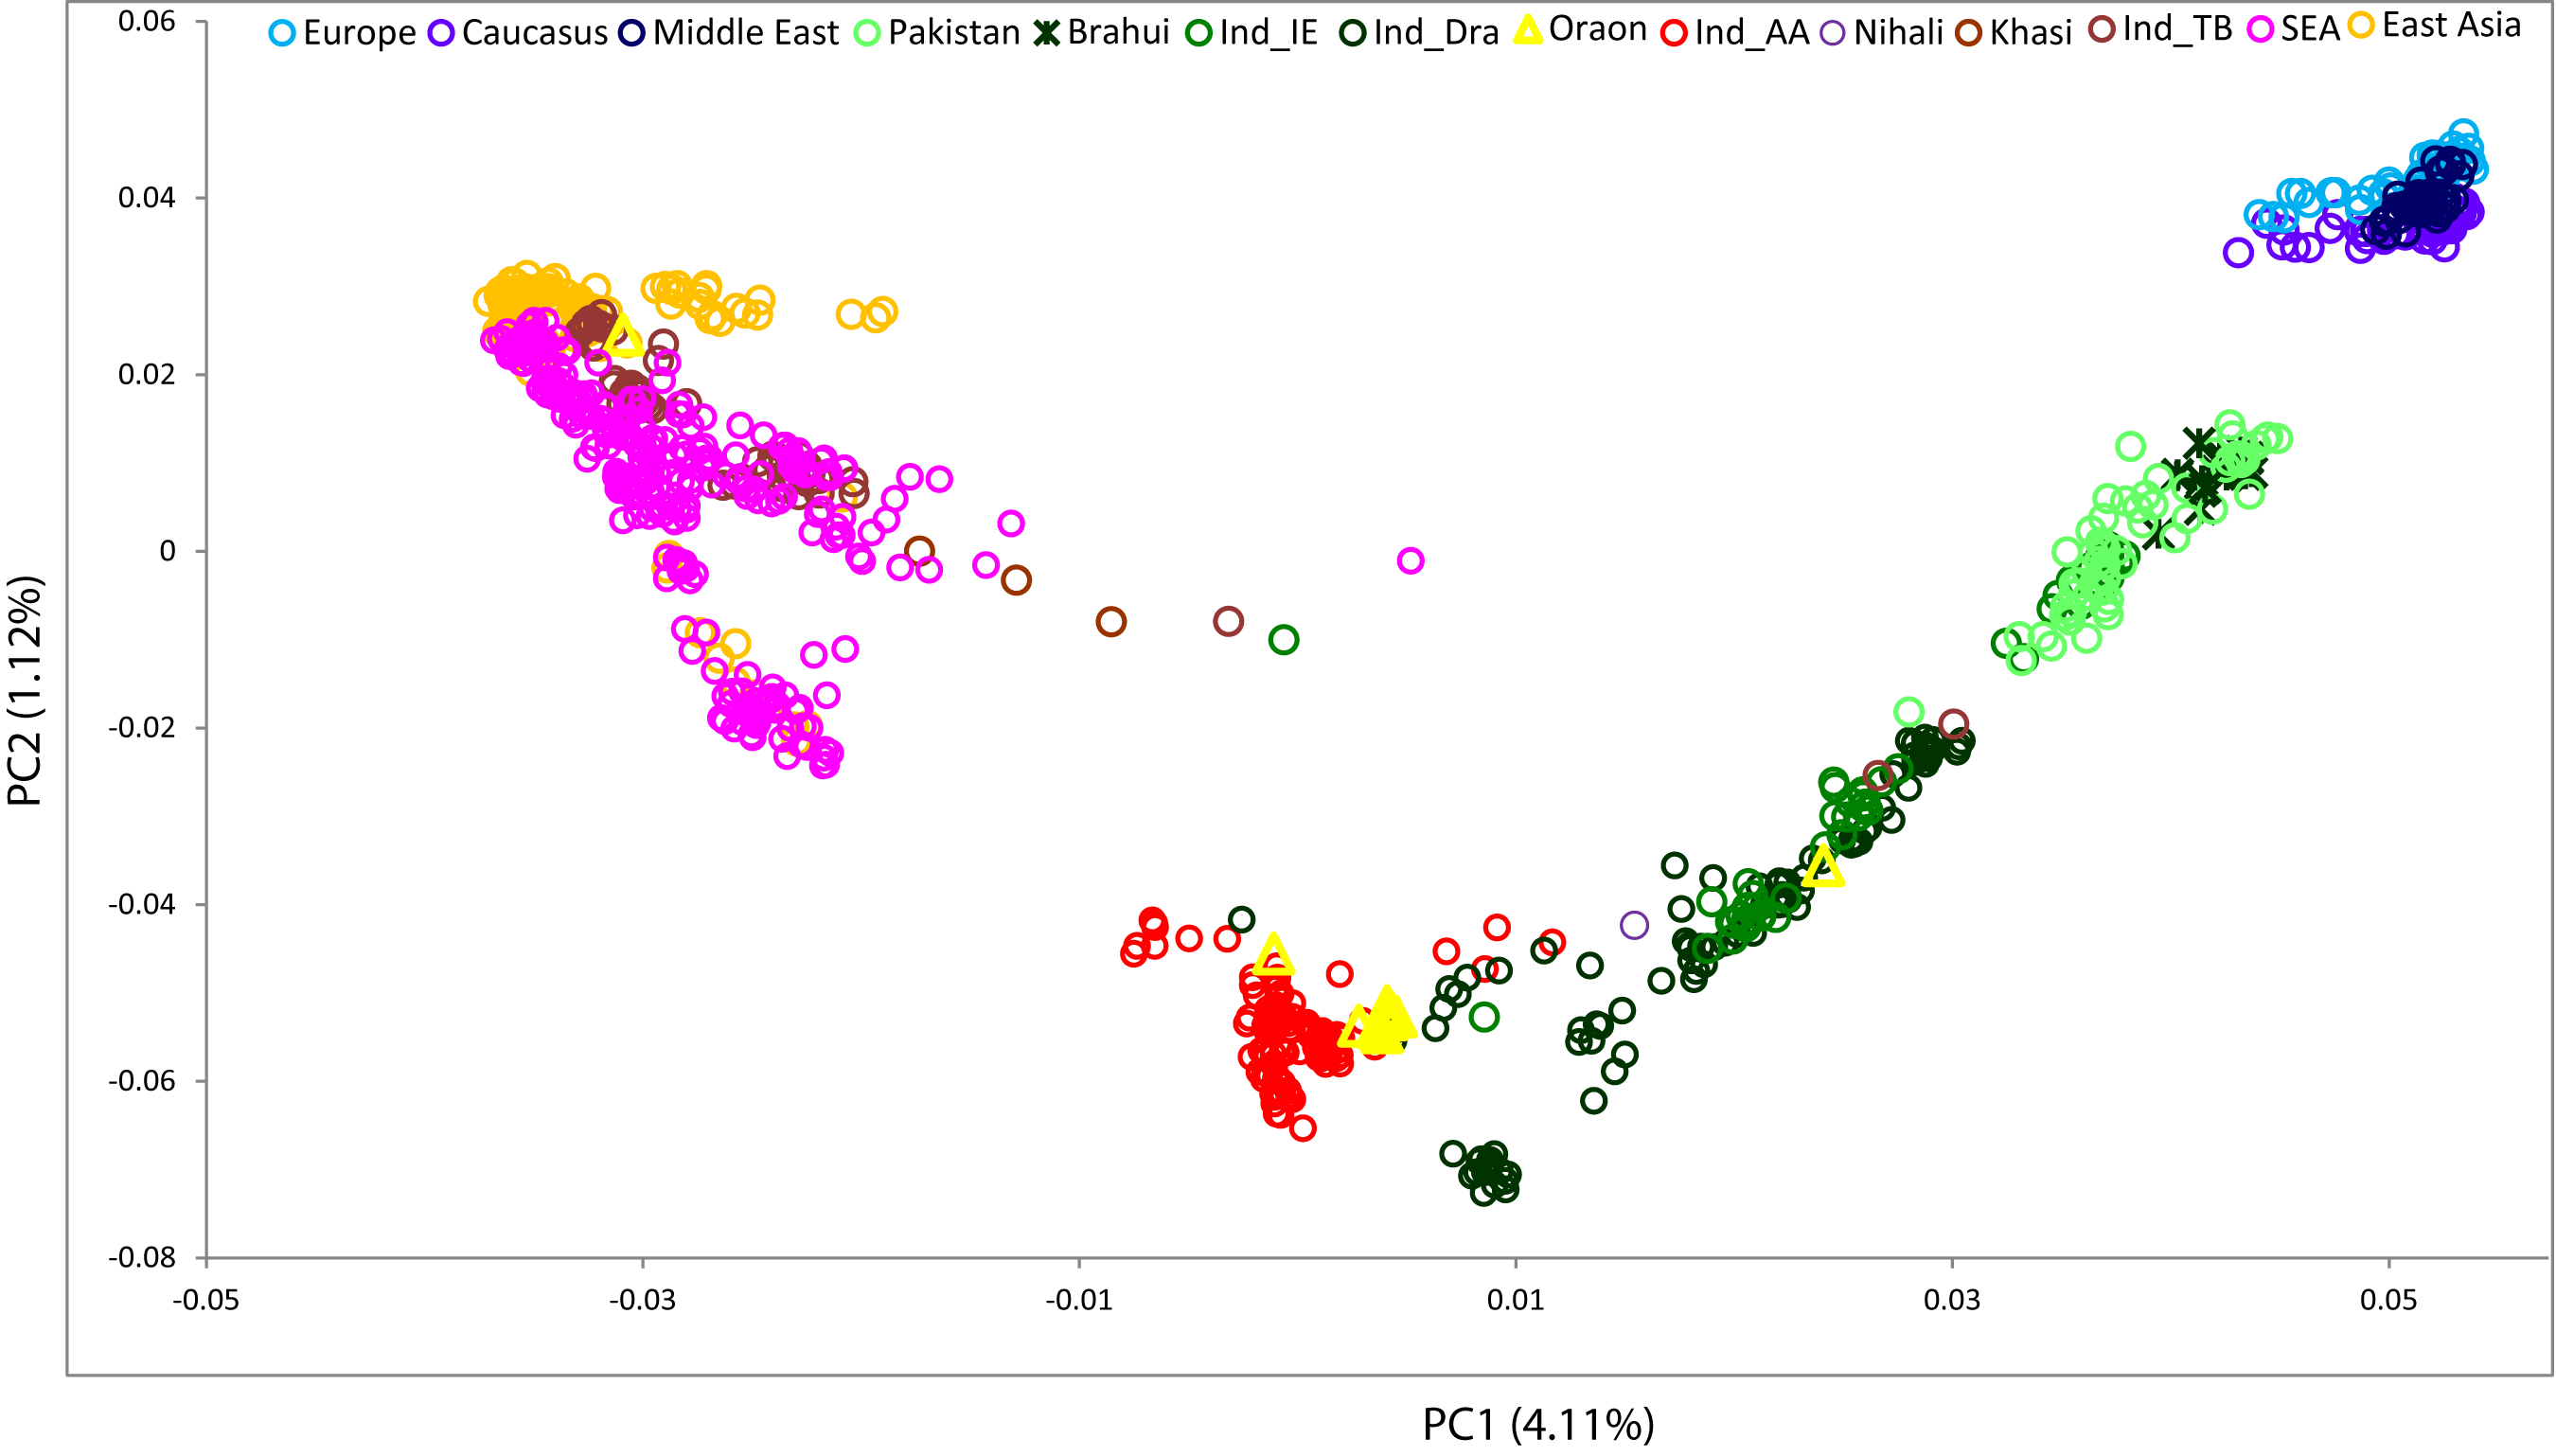
Figure 1. The scatterplot of Principal Component 1 (PC1) and Principal Component 2 (PC2) illustrates the genetic affinity between the Brahui and Oraon populations within the broader context of other Eurasian populations. A notable observation is that Oraon's genetic differentiation from the Austroasiatic (Mundari) speakers is primarily attributed to the variation in PC1.
The Oraon, along with another North Dravidian speaking population, the Gond, fall within the large Austroasiatic cluster, suggesting a closer genetic affinity with the Indian Austroasiatic (Mundari) speakers than with the Brahui (Figure 1). This pattern can be best explained by the local admixture of groups living in geographic proximity.
Next, to test whether the Brahui and Oraon populations share common ancestry components, we performed unsupervised ADMIXTURE analysis at K=14 (Figure S4) on genome-wide genotype data from global populations (Figure 2). We identified two genetic components in Brahui and four in Oraon, including one (light green) in common. The shared light green component is not specific to Dravidian-speaking populations but is common throughout South Asia. Besides this generic South Asian ancestry component, the Brahui have a West-Eurasian-related genetic component (purple), and the Oraon have an Austroasiatic-related component (red). The pattern of genetic component sharing among the Oraon closely resembles that observed in the Gond population. Ancestry component sharing has also been noted at lower K values (Figure S5). A distinction between the Brahui and Oraon became apparent at K=10, where they each exhibited distinct predominant components. At K=11, a unique component specific to the Paniya emerged, which was absent in the Brahui. The component specific to the Austroasiatic group appeared at K=12 and was significantly present in the Oraon but not in the Brahui. Both populations carried multiple components at various K values that were otherwise found in their immediate neighbors. It is noteworthy that the Oraon samples originating from northwestern Bangladesh did not exhibit any East/Southeast-Asian-related component (orange). The absence of this Trans-Himalayan predominant (orange) component among Bangladeshi Oraon suggests strong genetic isolation from their neighbouring populations.
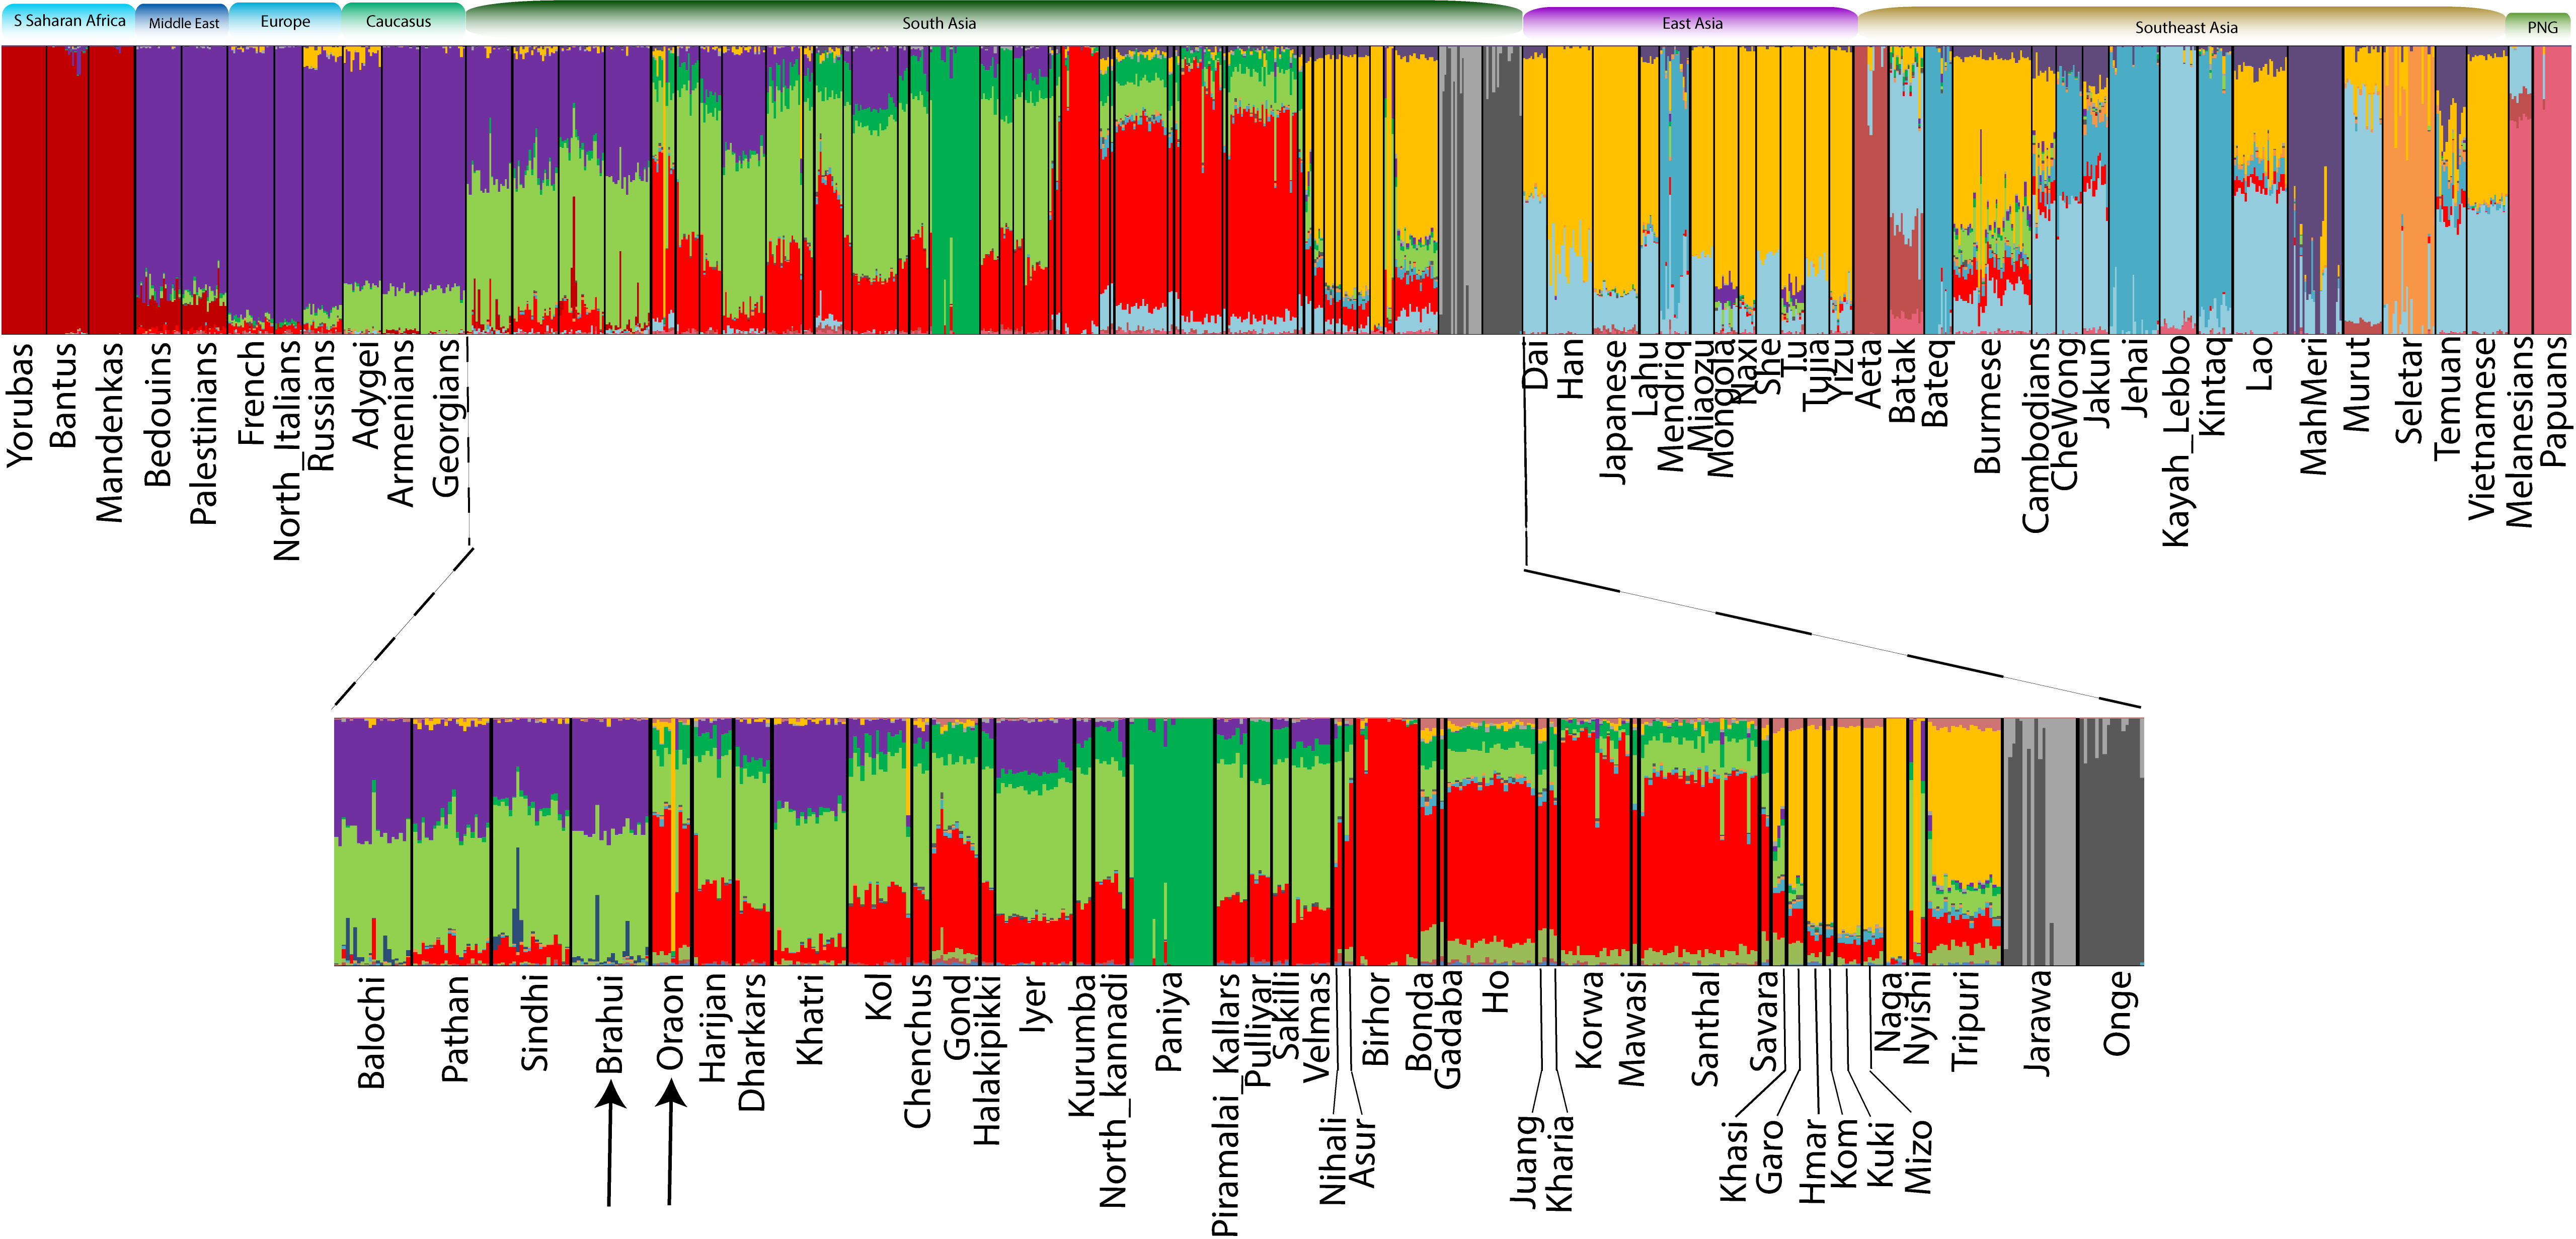
Figure 2. Global unsupervised ADMIXTURE analysis to examine the genetic component sharing of the Brahui and Oraon populations with other populations. The lower panel zooms in South Asian populations.
We tested how similar the sampled Oraon from northwestern Bangladesh were to the Indian Oraons. The PCA analysis placed both Oraon sample sets in the same cluster (Figure S6). The Fst analysis has shown the closest genetic affinity among the Oraon population from India and Bangladesh. The outgroup f3 analysis also found that the Indian Oraon represents the closest population to the Bangladeshi Oraon population, suggesting a common pool for the Oraon and underscoring the historically recent nature of the British colonial border drawn between them (Figure S6). The migration of Oraon to Bangladesh from India during the British time is well documented [9,10,44]. Moreover, the haploid DNA data (mtDNA and Y chromosome) haplogroups showed a largely similar composition for the Indian and Bangladeshi Oraon samples (Figure S7). Thus, our genetic data support the claims made on linguistic grounds about the migration of the Oraon from Chota Nagpur to Bangladesh, and their subsequent isolation.
We performed outgroup f3 analysis, using European French and East Asian Han populations as references representing West and East Eurasian ancestry (Figure 3). The Brahui remain closer to their neighbouring populations and show a profile similar to that of the Baloch. The Oraon have a genetic profile similar to that of the Gond whilst exhibiting slightly lower East-Asian-related ancestry than do the Austroasiatic (Mundari) and Gond populations (Figure 3). This result is also echoed in autosomal analyses (Figures 1 and 2) and Y chromosome haplogroup distribution, where the frequency of the East/Southeast Asian specific haplogroup O-M95 was significantly (two tailed p value <0.0001) lower amongst the Oraon population (Figure S7). The distinction between Oraon and Austroasiatic (Mundari) populations is also evident in the cultural artefacts. The Oraon have unique votive animal figurines which are absent among Indian Austroasiatics (Figure S3).
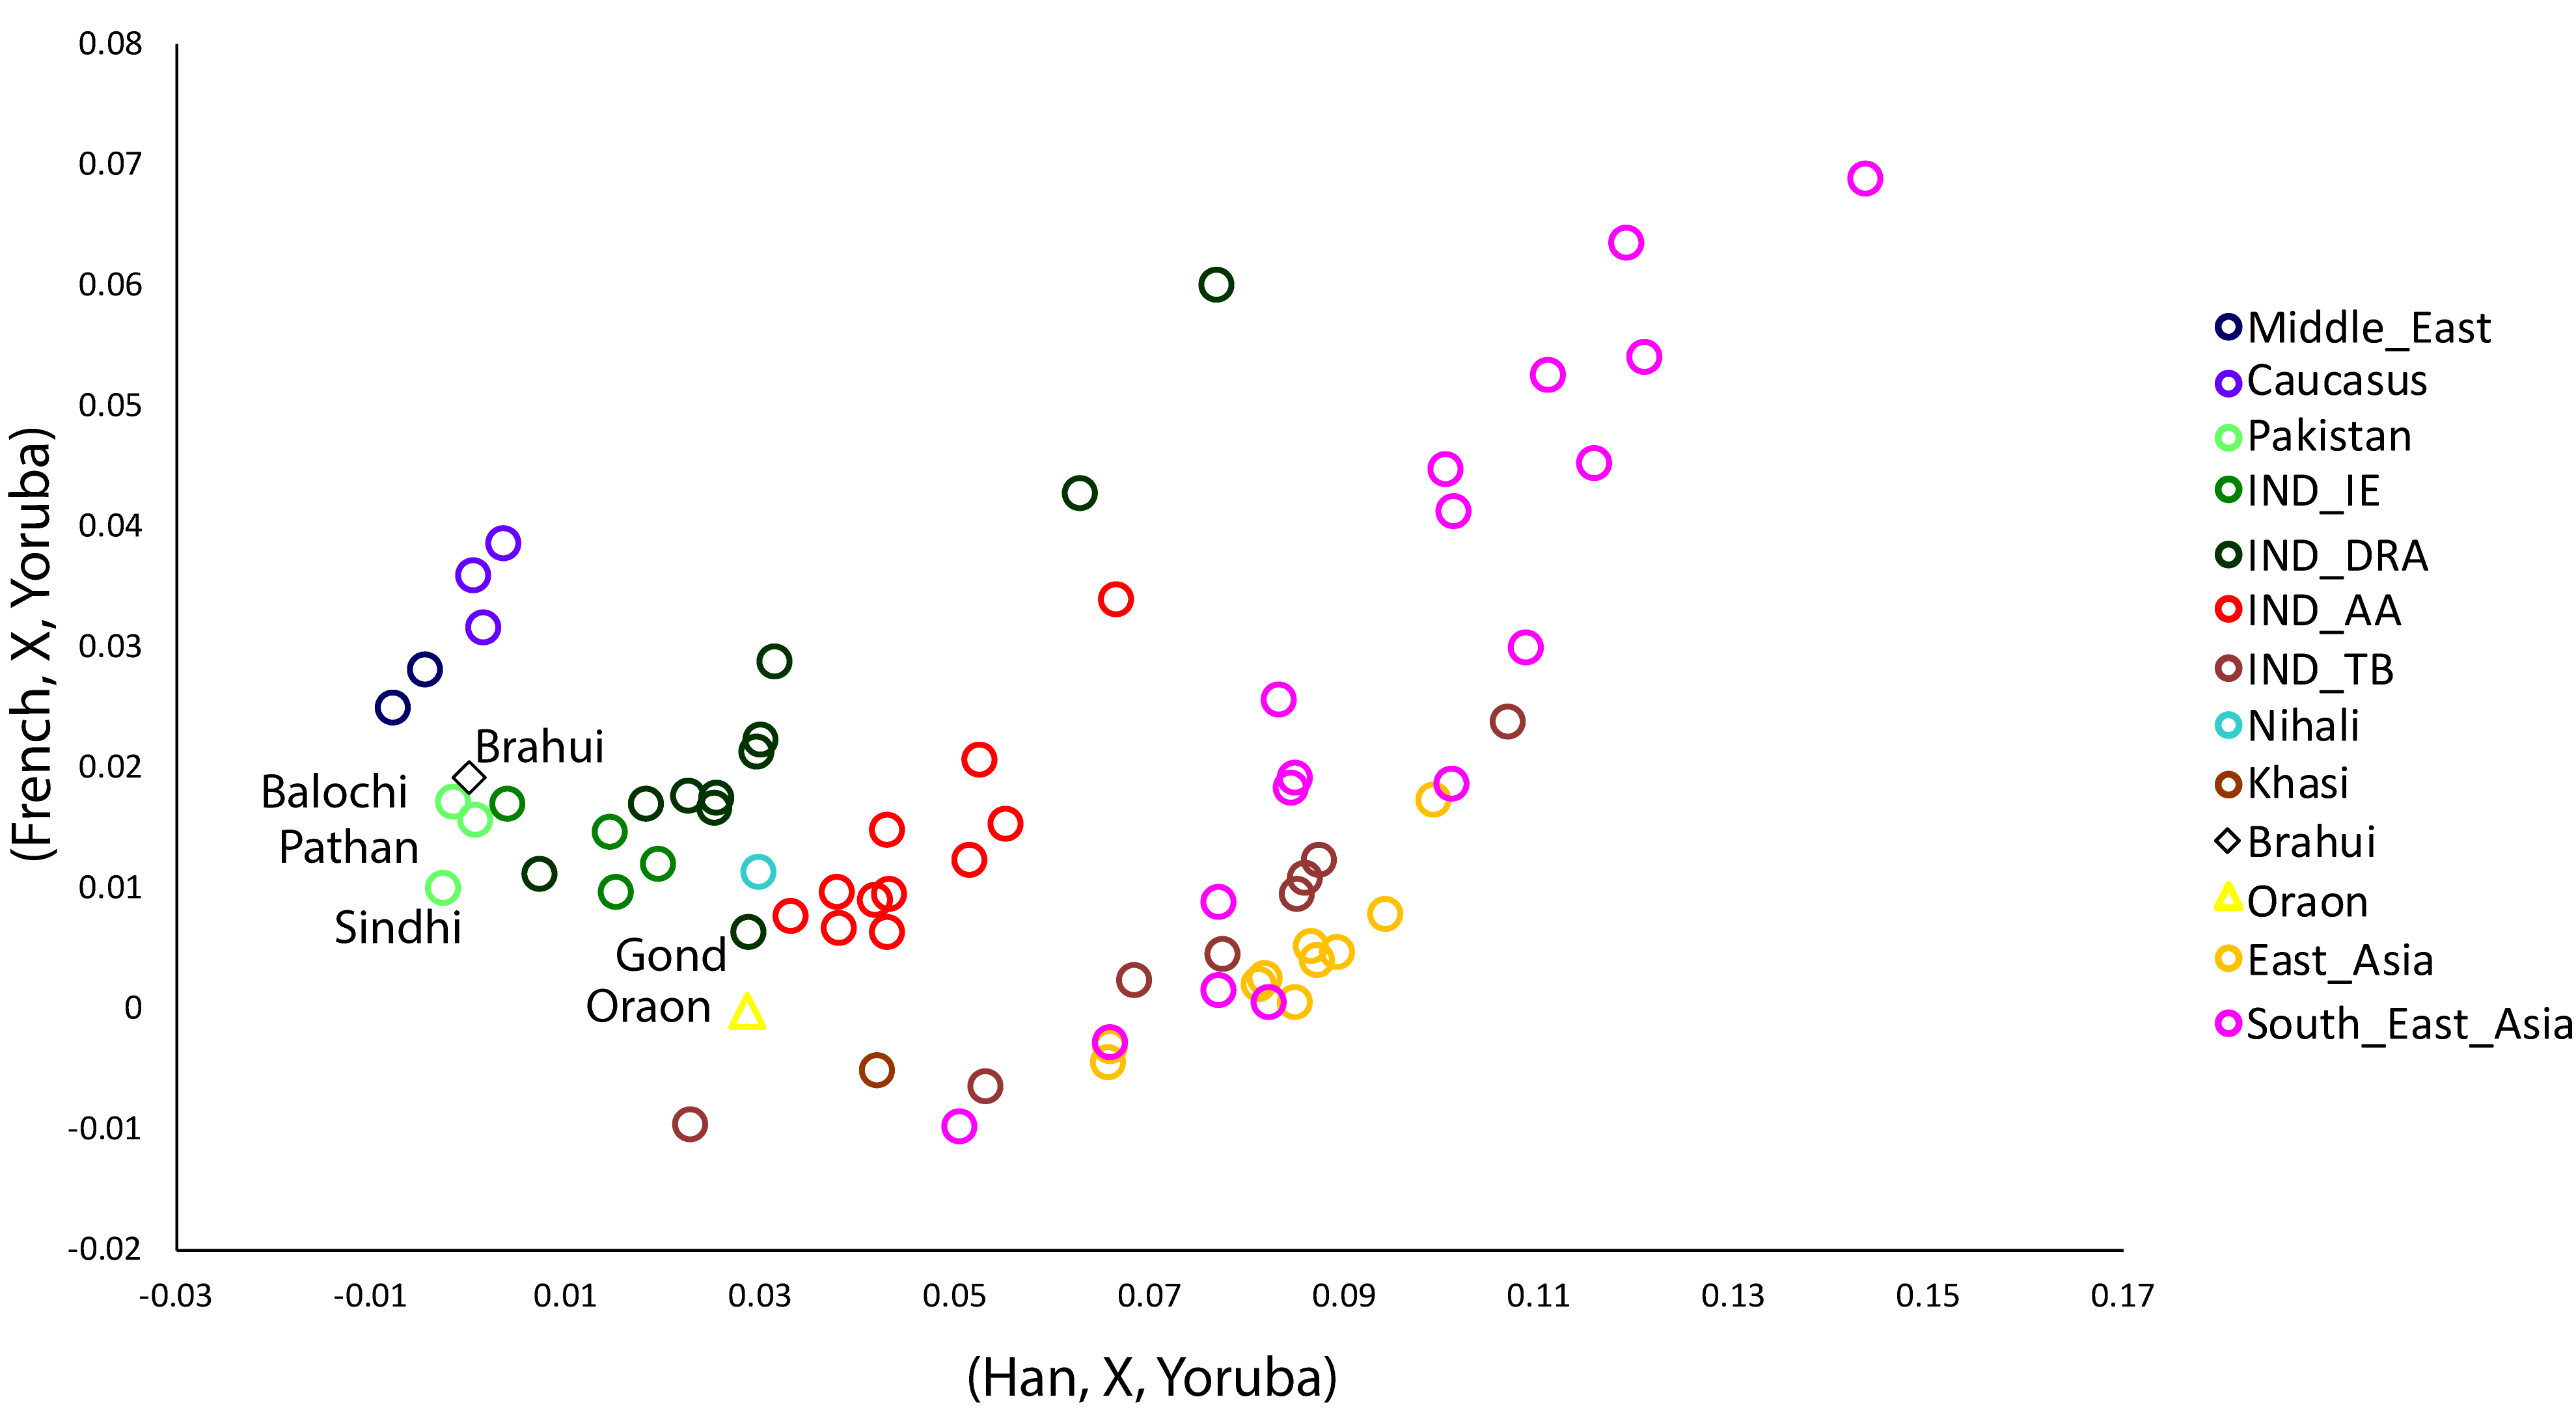
Figure 3. The two-dimensional scatterplot visually represents the shared genetic drift (f3) with European (French) and East Asian (Han) populations. It demonstrates the unique positioning of the Brahui and Oraon populations, both of which are closer to their neighboring populations.
To gain a better understanding of the population affinity, we performed haplotype-based analysis, i.e., fineStructure, the findings of which were also consistent in showing the close genetic affinity of the Brahui with their neighbouring populations (Figure 4). The maximum likelihood (ML) tree shows an interesting pattern for the Oraon. Indian Austroasiatic speakers and transitional populations form a superclade with two distinct branches. One branch exclusively comprised Mundari speakers, whereas the second branch comprised Oraon and other populations. The sub-branches are divided into two major parts. One part is exclusive to Dravidian speakers (Paniya and Pulliyar), whilst the second branch consists mainly of Oraon and Gond (7), Nihali (1), Asur (1), Harijan (1), Korawa (1), Santhal (1) and Mawasi (1). This result confirms a closer genetic affinity of the Oraon with the Gond and North Munda populations.
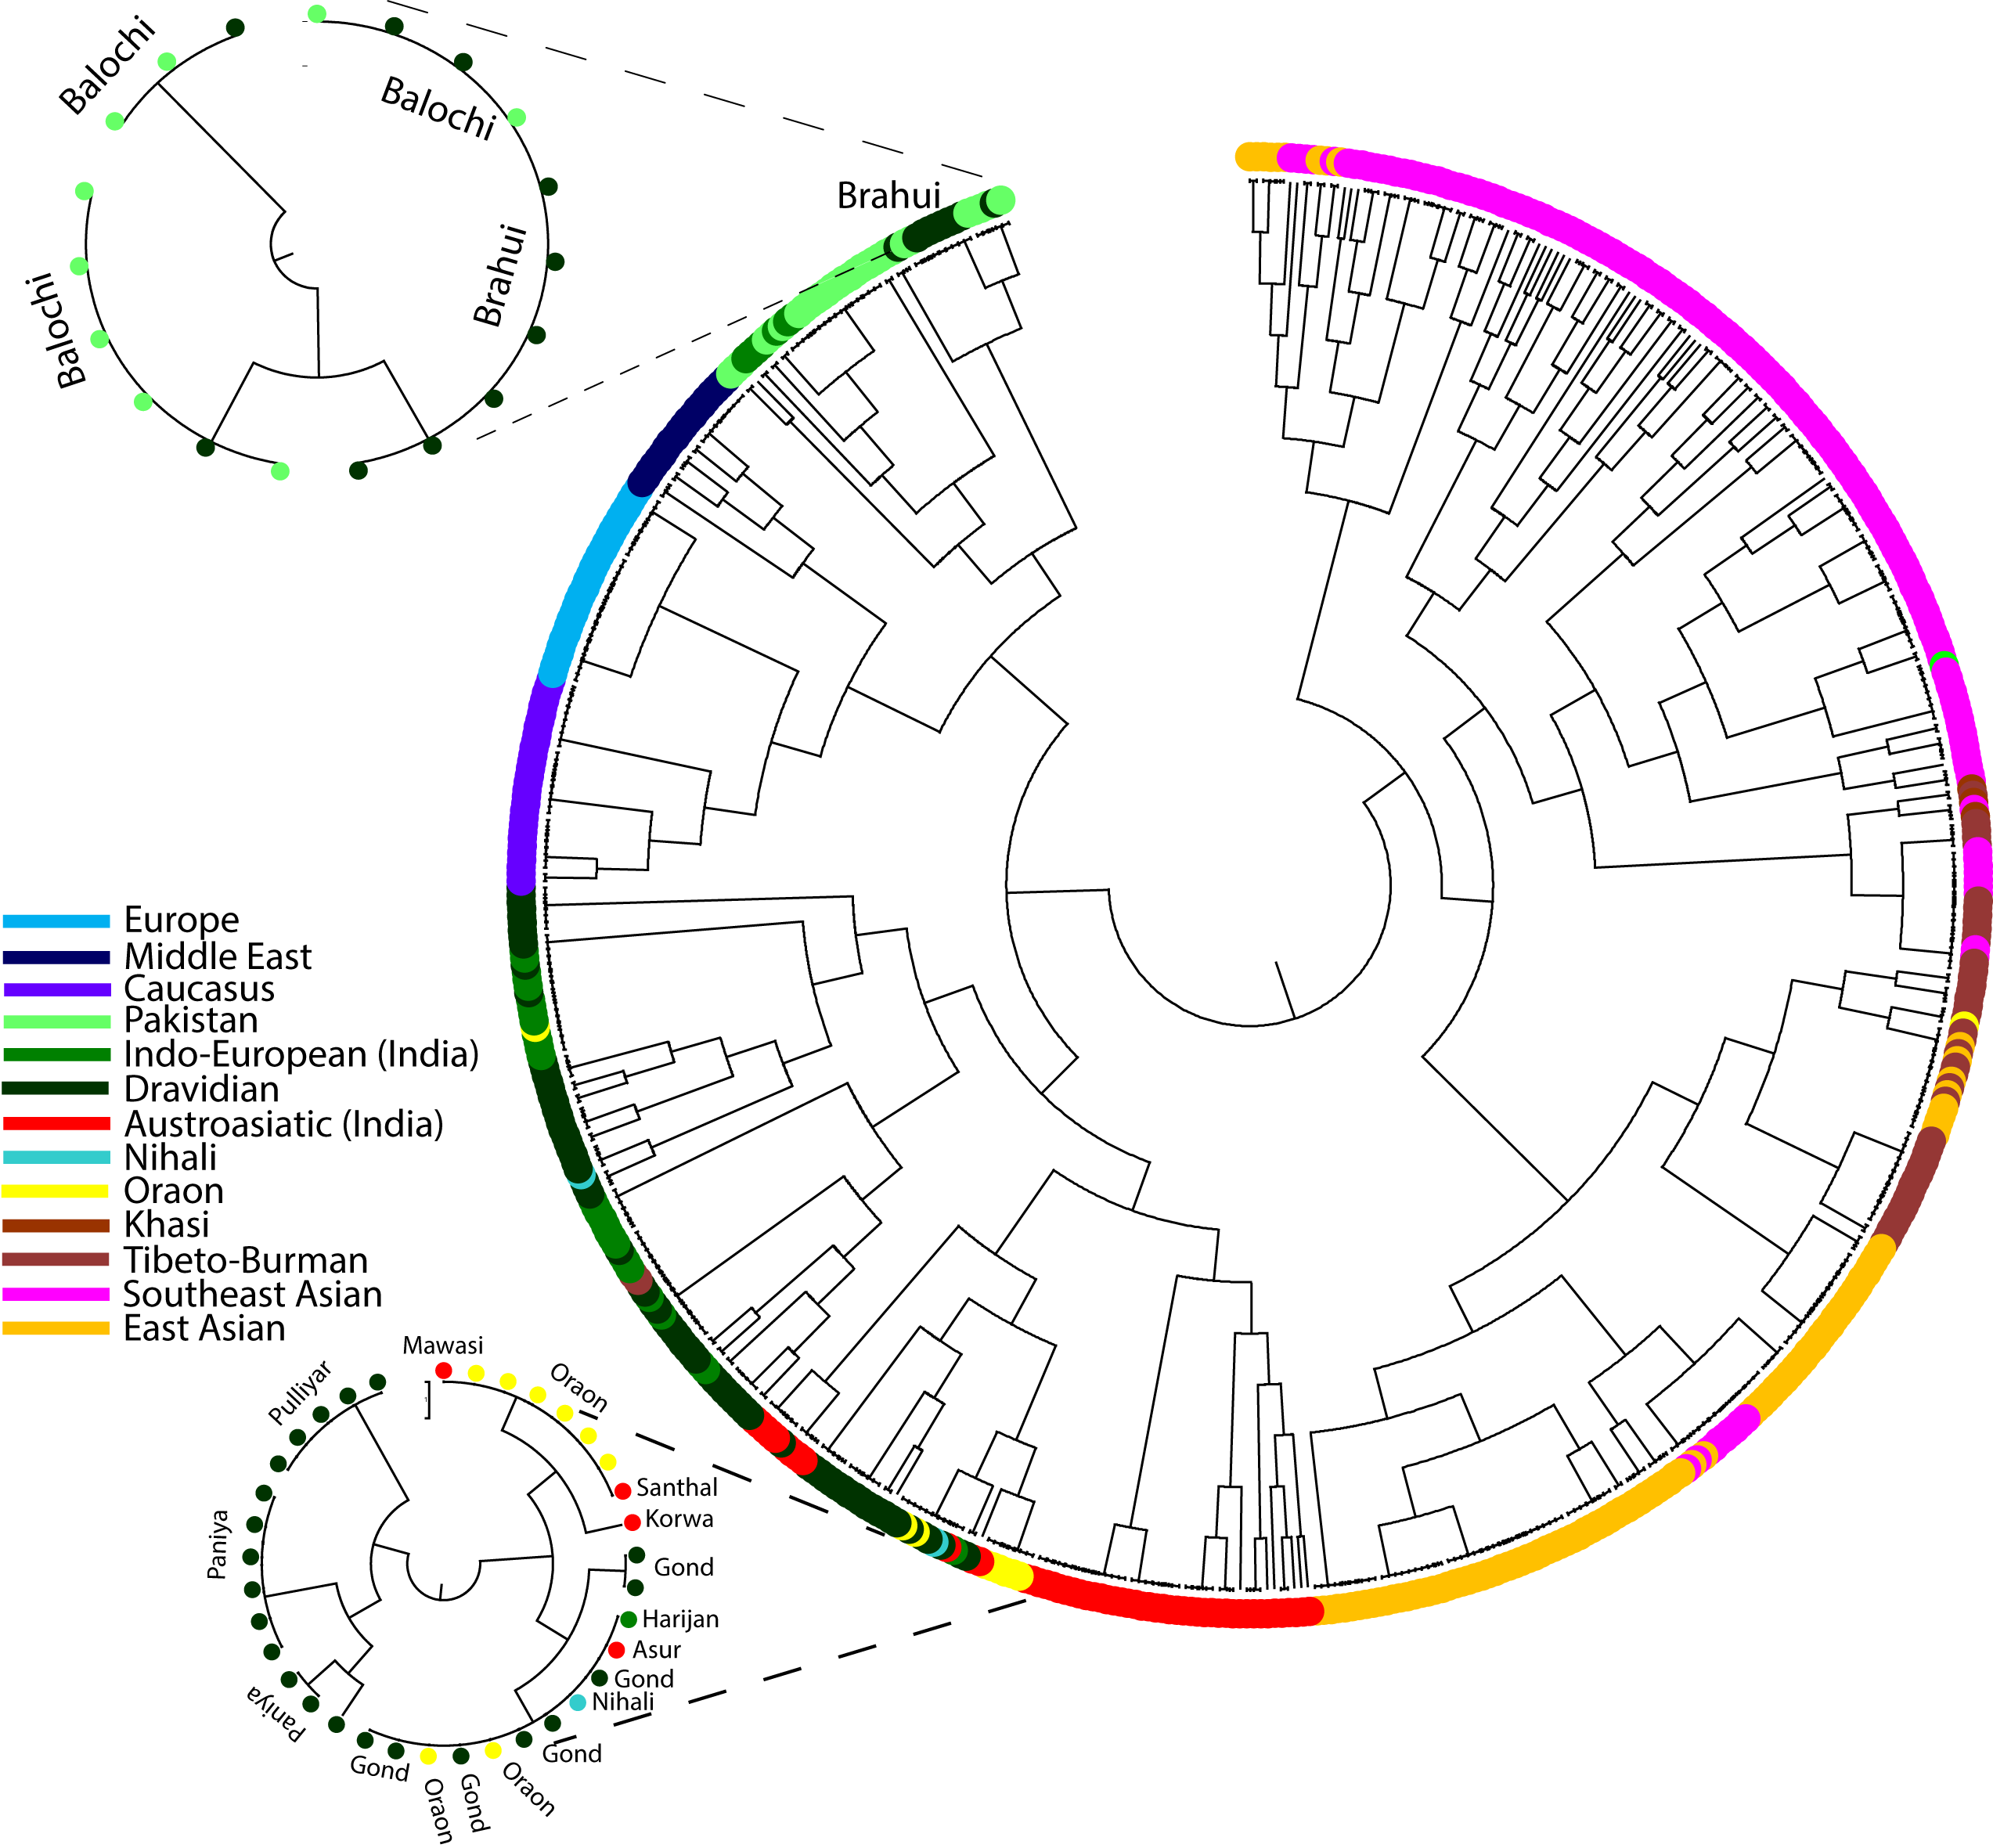
Figure 4. In the fineStructure analysis of Eurasian populations, the Maximum Likelihood (ML) tree was generated to examine the genetic relationships. Notably, the placement of Brahui and Oraon on distinct branches is highlighted in the detailed representation of the Oraon and Brahui branches on the tree.
The fineStructure analysis is capable of tracing a low amount of ancestry sharing [30]. Therefore, this assay may pick up subtle ancestry sharing between the Brahui and Oraon. We used the Oraon, Gond, Ho as a donor as well as a recipient for the Brahui and their closest neighbours, who speak the Indo-Iranian language, Balochi. The fineStructure analysis likewise failed to find any signal (Figure S8). Conversely, we found a significantly higher number of chunk donations from the Balochi to the Oraon than to the Brahui (two-tailed p value < 0.01). Interestingly, the runs of homozygosity (RoH) test showed the occurrence of a higher number and length of homozygous segments in the Brahui than in the Oraon (Figure S9). The Balochi also showed a similar pattern as the Brahui. The analysis of potential recent admixture events between the Oraon and Brahui populations did not yield any significant dates when employing the Alder, Malder, and Globetrotter methodologies. However, the FastGlobetrotter analysis indicated that the Oraon possess approximately 10% ancestry linked to Laos, with an estimated admixture timeframe of around 35 generations. This finding is particularly noteworthy, as all Austroasiatic populations in India typically exhibit a minimum admixture time of approximately 60 generations. This suggests that the Austroasiatic-specific component in the Oraon has a more recent and comparatively lower amount of ancestry, likely influenced by interactions with neighboring Austroasiatic populations.
To investigate how founder age and the strength of the Brahui and Oraon populations might illuminate their demographic histories, we utilised the ASCEND program [33]. Both populations showed evidence of recent founder events; however, the estimated range for the founder event among the Oraon was particularly variable, stretching up to 77 generations (Figure S10). As a result, this analysis did not provide significant insights into the research questions posed.
Similarly, our analyses of long shared allele intervals did not identify evidence of distant relationships between the Brahui and Oraon populations (Figure S11). The Brahui showed extensive sharing only with their neighbouring populations (Balochi, Sindhi, Pathan), whilst the Oraon showed the highest sharing with Mawasi (which is twice as high as with the Gond), again suggesting the strong genetic connection of the Oraon with the North Munda branch of Austroasiatic language communities.
The closer genetic affinity of the Oraon with the North Munda is evident in the autosomal analyses. To further evaluate their relationship, we utilised haploid DNA data. The predominant paternal signature of Mundari speakers, i.e., haplogroup O-M95, is lower (two tailed p value <0.0001) among the Oraon (Figure S7). To compare maternal ancestry, we used haplotype-level comparison because there is no distinct haplogroup pattern associated with Mundari speakers [39]. We observed eight haplotypes present among both groups (Figure S12). The shared haploid ancestry among Oraon more likely represents the gene flow from Mundari speakers which might have occurred due to geographical proximity.
In conclusion, our genetic analysis found no common genetic signal of recent ancestry between the Brahui and their closest linguistic relatives, the Oraon. In the Brahui, therefore, we appear to observe a rare phenomenon in the South Asian context of a population that has lost most of its genetic founder signature but preserved its original language in situ. Thus, we validate previously obtained results for the Brahui based on the required additional evidence. Moreover, our high-resolution study on Oraon strongly excludes any classification of this population as Austroasiatic, e.g., Mundari, but demonstrates that the Oraon instead represent a unique North Dravidian population. However, a significant gene flow between the Oraon and North Munda populations (Mawasi) was detected. The Oraon of India and Bangladesh share a common stock and represent a population speaking the Kurukh language of the North Dravidian branch.
The following supplementary materials are available on the website of this paper: HPGG2505010003SupplementaryMaterials.zip
Figure S1: The Dravidian speakers live in South Asia.
Figure S2: Map showing the distribution of Oraon in South Asia modified from Joshua project.
Figure S3: Livelihood and cultural practices of the Oraon.
Figure S4: Plot representing cross validation (CV) error for various ancestral components (K) values of ADMIXTURE analysis.
Figure S5: Bar plot representing the admixture pattern at different components (K10-K15).
Figure S6: Comparison of Bangladeshi and Indian Oraon populations.
Figure S7: Bar plot showing the mt- DNA haplogroup frequencies of Oraon from different places as well as Y-chromosomal haplogroup frequencies among Oraon and Munda populations.
Figure S8: Donor Chunks count plot showing Oraon, Gond, Ho as a donor as well as a recipient with respect to the Brahui and their closest neighbours.
Figure S9: Scatterplot showing Runs of homozygosity (RoH) of the Eurasian populations.
Figure S10: Decay curves for Brahui and Oraon population.
Figure S11: Average probabilities for individuals from Brahui (blue) and Oraon (orange) populations to share at least one IBD segment >5cM with individuals from 81 selected populations included in this study.
Figure S12: Venn diagram represents the mitochondrial DNA haplogroup sharing of Oraon and Munda populations.
Table S1: mtDNA HVS-I, related coding marker, sample ids, haplogroup affiliation and geographical location details.
Table S2: Y-chromosomal haplogroup markers details.
Table S3: Population list included in the present study from different regions.
Not applicable.
Not applicable.
The data that support the findings of this study are available from Figshare repository (10.6084/m9.figshare.28053170).
Samples were collected under research supported by a National Geographic grant HJ3-182R-18. RKM is supported by Malaviya-PDF (IoE/MPDF/2020-21) grant. GC is supported by ICMR ad-hoc grants (2021-6389), (2021-11289) and BHU IoE incentive grant BHU (6031). PPS is supported by the RJP-PDF grant of Banaras Hindu University. SD is supported by the CSIR-JRF fellowship. AKP is supported by Estonian Research Council Grant Number PUTJD1186. RT was supported by SERB - CRG/2018/001727.
Toomas Kivisild is a member of the Editorial Board of the journal Human Population Genetics and Genomics. The author was not involved in the journal’s review of or decisions related to this manuscript. The authors have declared that no other competing interests exist.
Conceptualization: GNNS and GC; Investigation: GNNS, MM, SKT and GC; Formal Analysis: PPS, AKP, SKT, SD, RKM and TK; Writing - Original Draft: PPS, AKP, TK, RT, VS, RV, GvD, GC
| 1. | van Driem G. Languages of the Himalayas: An Ethnolinguistic Handbook of the Greater Himalayan Region containing an Introduction to the Symbiotic Theory of Language. Leiden: Brill; 2001. [CrossRef] |
| 2. | Denys DSB. The Brahui Language, Part I: Introduction and Grammar. Calcutta: Superintendent of Government Printing; 1909. |
| 3. | Denys DSB. The Brahui Language, Part II: The Brahui Problem, and Part III: Etymological Dictionary. Delhi: Manager of Publications; 1934. |
| 4. | Qamar R, Ayub Q, Mohyuddin A, Helgason A, Mazhar K, Mansoor A, et al. Y-chromosomal DNA variation in Pakistan. Am J Hum Genet. 2002;70(5):1107-1124. [Google Scholar] [CrossRef] |
| 5. | Quintana-Murci L, Chaix R, Wells RS, Behar DM, Sayar H, Scozzari R, et al. Where west meets east: the complex mtDNA landscape of the southwest and Central Asian corridor. Am J Hum Genet. 2004;74(5):827-845. [Google Scholar] [CrossRef] |
| 6. | Pagani L, Colonna V, Tyler-Smith C, Ayub Q. An ethnolinguistic and genetic perspective on the origins of the Dravidian-speaking Brahui in Pakistan. Man in India. 2017;97(1):267-268. [Google Scholar] |
| 7. | Risley HH. The Tribes and Castes of Bengal (2 volumes). Calcutta: Bengal Secretariat Press; 1891. |
| 8. | Pfeiffer M. Elements of Kuṛux Historical Phonology. Leiden: E.J. Brill; 1972. |
| 9. | Biswas C, Ray M. Migration at Border: An Anthropological Study on Cross-border Oraons in North 24-Parganas, W. Bengal, India. Mediterr J Soc Sci. 2013;4(13):683. [Google Scholar] [CrossRef] |
| 10. | Sarkar BC. Economic Transformation of Tribal People from Primitive to Tea Garden Workers in Dooars of Jalpaiguri District. Int J Res Cult Soc. 2017;1(8):160-165. [Google Scholar] |
| 11. | Zvelebil KV. Dravidian Linguistics: An Introduction. Pondicherry: Pondicherry Institute of Linguistics and Culture; 1990. |
| 12. | Krishnamurti B. The Dravidian Languages. Cambridge: Cambridge University Press; 2003. |
| 13. | Xalxo AR. An overview of language, culture and identity of the Oraon tribe in Odisha. Language in India. 2018;18(5):27. [Google Scholar] |
| 14. | Schrader O. Dravidisch und Uralisch. Zeitschrift für Indologie und Iranistik. 1925;3:81-112. [Google Scholar] |
| 15. | Chatterji SK. Race movements and prehistoric culture In: The Vedic Age. In: Majumdar RC, editor. London: George Allen & Unwin; 1951. p.141-168. |
| 16. | Emeneau MB. Brahui and Dravidian Comparative Grammar (University of California Publications in Linguistics, XXVII). Berkeley: University of California Press; 1962. |
| 17. | Andronov MS. Dravidijskie jazyki. Moscow: Izdatel’stvo ‘Nauka’; 1965. |
| 18. | Andronov MS. Jazyk Braui. Moscow: Izdatel’stvo ‘Nauka’; 1971. |
| 19. | Andronov MS. Sravnitel’naja grammatika dravidijskix jazykov. Moscow: Izdatel’stvo ‘Nauka’; 1978. |
| 20. | Zvelebil KV. Harappa and the Dravidians: An old mystery in a new light. New Orient. 1965;4(3):65-59. [Google Scholar] |
| 21. | Zvelebil KV. Reviewed Work: Proto-Elamo-Dravidian: The Evidence and Its Implications David W. McAlpin. J Am Orient Soc. 1985;105(2):365-372. [Google Scholar] [CrossRef] |
| 22. | Burrow T. The Sanskrit Language. London: Faber and Faber; 1973. |
| 23. | Parpola A. Deciphering the Indus Script. Cambridge: Cambridge University Press; 1994. |
| 24. | Thangaraj K, Gupta NJ, Pavani K, Reddy AG, Subramanian S, Rani DS, et al. Y chromosome deletions in azoospermic men in India. J Androl. 2003;24(4):588-597. [Google Scholar] [CrossRef] |
| 25. | Chang CC, Chow CC, Tellier LC, Vattikuti S, Purcell SM, Lee JJ. Second-generation PLINK: rising to the challenge of larger and richer datasets. GigaScience. 2015;4:7. [Google Scholar] [CrossRef] |
| 26. | Nakatsuka N, Moorjani P, Rai N, Sarkar B, Tandon A, Patterson N, et al. The promise of discovering population-specific disease-associated genes in South Asia. Nat Genet. 2017;49(9):1403-1407. [Google Scholar] [CrossRef] |
| 27. | Patterson N, Price AL, Reich D. Population structure and eigenanalysis. PLoS Genet. 2006;2(12):e190. [Google Scholar] [CrossRef] |
| 28. | Alexander DH, Novembre J, Lange K. Fast model-based estimation of ancestry in unrelated individuals. Genome Res. 2009;19(9):1655-1664. [Google Scholar] [CrossRef] |
| 29. | Patterson N, Moorjani P, Luo Y, Mallick S, Rohland N, Zhan Y, et al. Ancient admixture in human history. Genetics. 2012;192(3):1065-1093. [Google Scholar] [CrossRef] |
| 30. | Lawson DJ, Hellenthal G, Myers S, Falush D. Inference of population structure using dense haplotype data. PLoS Genet. 2012;8(1):e1002453. [Google Scholar] [CrossRef] |
| 31. | Browning SR, Browning BL. Haplotype phasing: existing methods and new developments. Nat Rev Genet. 2011;12(10):703-714. [Google Scholar] [CrossRef] |
| 32. | Kumar S, Stecher G, Tamura K. MEGA7: molecular evolutionary genetics analysis version 7.0 for bigger datasets. Mol Biol Evol. 2016;33(7):1870-1874. [Google Scholar] [CrossRef] |
| 33. | Wangkumhang P, Greenfield M, Hellenthal G. An efficient method to identify, date and describe admixture events using haplotype information. Genome Res. 2022;32(8):1553-1564. [Google Scholar] [CrossRef] |
| 34. | Loh PR, Lipson M, Patterson N, Moorjani P, Pickrell JK, Reich D, et al. Inferring admixture histories of human populations using linkage disequilibrium. Genetics. 2013;193(4):1233-1254. [Google Scholar] [CrossRef] |
| 35. | Chimusa ER, Defo J, Thami PK, Awany D, Mulisa DD, Allali I, et al. Dating admixture events is unsolved problem in multi-way admixed populations. Brief Bioinform. 2020;21(1):144-155. [Google Scholar] [CrossRef] |
| 36. | Tournebize R, Chu G, Moorjani P. Reconstructing the history of founder events using genome-wide patterns of allele sharing across individuals. PLoS Genet. 2022;18(6):e1010243. [Google Scholar] [CrossRef] |
| 37. | Seidman DN, Shenoy SA, Kim M, Babu R, Woods IG, Dyer TD, et al. Rapid, Phase-free Detection of Long Identity-by-Descent Segments Enables Effective Relationship Classification. Am J Hum Genet. 2020;106(4):453-466. [Google Scholar] [CrossRef] |
| 38. | Kivisild T, Saag L, Hui R, Biagini SA, Pankratov V, d'Atanasio E, et al. Patterns of genetic connectedness between modern and medieval Estonian genomes reveal the origins of a major ancestry component of the Finnish population. Am J Hum Genet. 2021;108(9):1792-1806. [Google Scholar] [CrossRef] |
| 39. | Chaubey G, Metspalu M, Choi Y, Mägi R, Romero IG, Soares P, et al. Population genetic structure in Indian Austroasiatic speakers: The role of landscape barriers and sex-specific admixture. Mol Biol Evol. 2011;28(2):1013-1024. [Google Scholar] [CrossRef] |
| 40. | Basu A, Sarkar-Roy N, Majumder PP. Genomic reconstruction of the history of extant populations of India reveals five distinct ancestral components and a complex structure. Proc Natl Acad Sci U S A. 2016;113(6):1594-1599. [Google Scholar] [CrossRef] |
| 41. | GenomeAsia100K Consortium. The GenomeAsia 100K Project enables genetic discoveries across Asia. Nature. 2019;576:106-111. [Google Scholar] [CrossRef] |
| 42. | Tagore D, Aghakhanian F, Naidu R, Phipps ME, Basu A. Insights into the demographic history of Asia from common ancestry and admixture in the genomic landscape of present-day Austroasiatic speakers. BMC Biol. 2021;19:1-19. [Google Scholar] [CrossRef] |
| 43. | Kumar V, Reddy AN, Babu P, Rao TN, Thangaraj K, Reddy AG, et al. Molecular genetic study on the status of transitional groups of central India: Cultural diffusion or demic diffusion? Int J Hum Genet. 2008;8(1-2):31-39. [Google Scholar] |
| 44. | Hembram S, Kisku AK. The Sacred Grove and the Livelihood and Identity of Santals In: Indigenous Architecture in India. Abingdon: Routledge India; 2024. p.47-63. [CrossRef] |

![]()
Copyright © 2026 Pivot Science Publications Corp. - unless otherwise stated | Terms and Conditions | Privacy Policy


