Introduction
In their 1978 Science paper, Paolo Menozzi, Alberto Piazza and Luca Cavalli-Sforza [1] showed how we could read in our cells the message sent to us by millions of ancestors, finding a way to disclose otherwise obscure aspects of our past.
Already in the 1930s, through what Julian Huxley called the modern synthesis, i.e. the development of models describing the transmission of quantitative traits (as well as the effects of inbreeding, selection, gene flow and drift), population genetics had become a fundamental tool in the study of evolution.
However, applications to humans were limited by the impossibility of conducting experiments and by the paucity of suitable data.
The word genomics did not exist at that time, but in the 1960s Luca Cavalli-Sforza was already thinking in genomic terms; he was the first to propose comparisons of multiple genes to infer the relative role of selection and drift in causing variation [2]; see Richard Nichols’ contribution in this issue. Doing genomic analysis, however, was challenging at that time. Apart from the technical impossibility of directly comparing DNA sequences, it was not obvious how one could summarize variation across loci, since the data for each locus came from populations sampled at different points in the geographical space. Luca Cavalli-Sforza’s intuition told him that, if he could somehow overcome these difficulties, then he could exploit the full potential of population-genetic methods and obtain new insights into human evolutionary history. Ultimately, the results went beyond everyone’s expectations. The Menozzi et al. study [1] is now recognized as the starting point of a deeper investigation of the human past, based on an unprecedented dialogue among experts of diverse fields, such as paleontology, archaeology, anthropology, linguistics and, of course, population genetics.
Methods
Interpolation
Menozzi et al. collected data on 38 independent alleles from 10 loci, where ‘independent’ meant that one allele at each locus was omitted from the analysis. Some of these data came from a study of HLA markers in 67 European populations [3], while the rest were from Mourant et al.’s monumental compilation of blood group and serum protein variants [4]. I did not find the analyzed sample sizes for each marker in Menozzi et al. If the dataset was the same as that later used by Sokal et al. [5], as seems likely, the values ranged from 70 for phosphoglucomutase (PGM) to 870 for AB0; for no population was the entire set of allele frequencies available. Making such a diverse dataset amenable to analysis was the first problem faced. The obvious strategies were clearly inefficient. If one started from the 870 localities sampled for AB0, for most of which no other genetic information was available, the enormous amount of missing data would have hampered the analysis. By contrast, most of the information would have been lost if one only considered the localities for which a certain fraction, say, 50% or even 20%, of the allele frequencies were known. To counteract these problems, Menozzi et al. devised a different procedure. After mapping allele frequencies—one map for each gene—they used interpolation to calculate the allele frequencies at each of 400 preselected locations at the nodes of a grid superimposed on Europe and the Near East. With this technique, they obtained 38 allele-frequency maps, all of which included the same 400 geographical data points and hence were comparable.
Principal component analysis (PCA)
Menozzi
et al. could then use PCA to concentrate the information contained in their 38 allele-frequency maps into a smaller number of synthetic maps, each of which accounted for a greater fraction of the overall variance than did any of the original maps. Suitable methods of multivariate analysis had already been developed in the 1930s [
6]; for more details, see [
7], but there had been few applications to evolutionary biology. From a geometrical standpoint, one could imagine the data as a cloud of points in a multidimensional space, each dimension representing a variable, an allele frequency in this case. The first principal component corresponds to the line passing through the multidimensional mean and minimizing the sum of the squared distances between the points and the line. Additional principal components are similarly estimated, after subtracting from the data the correlation with the previous principal component(s), for any arbitrary number of components. Principal components, termed S in Menozzi
et al.’s (1978) paper, were calculated at each node of the grid as linear combinations of the allele frequencies:
etc.
where p1, p2…pk are the interpolated allele frequencies, and α, β etc. are the coefficients estimated so as to minimize the amount of information lost in the transformation. In this way, it was possible to subdivide the overall variance in components of decreasing importance, each in principle independent from the others, and each accounting for a fraction of the variance not retrieved in previous steps of the analysis.
Mapping the principal components (PCs)
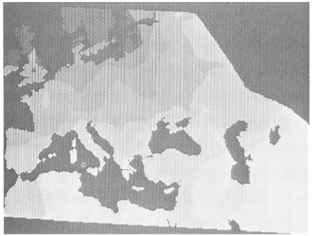
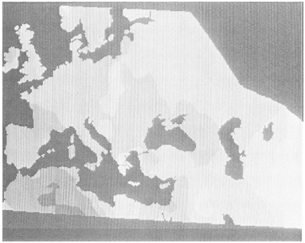
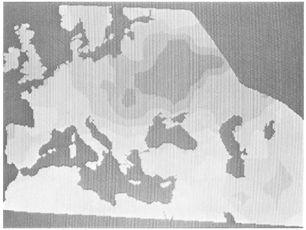
The values of each PC were then projected onto a map of Europe. However, for purposes of graphical representation, the image generated by 400 geographical points was not sufficiently detailed. Hence, the authors recalculated the values of the PCs using a narrower grid, again by interpolation. The resulting maps were displayed on another innovative tool at that time, the computer screen. Photographs were taken, films were developed, and images were printed. Figures 1, 2 and 3, reproduced from the original article, represent the geographical distribution of the first three PCs, respectively accounting for 27, 18 and 11% of the total variance.
Interpreting the results: from the pattern to the process
Archaeological evidence showed that farming activities, documented by the discovery of farming tools, large numbers of crop seeds, and later ceramics, spread in Europe from the Near East at ‘a relatively slow and regular’ pace, around 1 km per year [8,9]. The onset and diffusion of farming between 9000 and 5000 years BP in Europe, and later in other continents [10], was known as the Neolithic transition and is considered one of the most momentous events in human history [11,12]; it was then that humans began raising their food as opposed to gathering it. Schematically, one could regard it either as a mainly cultural process through adoption of new subsistence technologies by former hunting-gathering populations, or as a demographic process involving a westward and northward dispersal of Near Eastern farmers, largely replacing the indigenous residents. Of course, many intermediate possibilities exist, but it is worthwhile simplifying the debate this way for the sake of clarity. From an archaeological standpoint, there is no way to say if the same people began doing new things (a cultural development), or if new people introduced new technologies (a demographic transition). However, genetic data could help, because gene flow has recognizable genetic consequence, which are not expected under a model of cultural transmission.
Both the first PC map, and the map of the dates of earliest Neolithic sites, showed a broad, continent-wide gradient centered in the Near East, with a minimum in the British Isles and Scandinavia. Menozzi et al. concluded that the two phenomena were not only correlated, but that the genetic pattern explained the archaeological pattern; gene flow (although not exclusively, as we shall see) was the main cause of the transition observed at the archaeological level. The authors also considered the possibility that the gradient could have arisen in response to some selective pressure, but argued that climate, the most plausible selective agent, would have caused north-south, and not northwest-southeast gradients.
Finally, the consequences of another possible migration phenomenon were tentatively identified in the third PC, suggesting a westward population movement from what is now the Ukraine. The cautious interpretation put forward was that further work and a broader dataset were needed to make sure that the third PC pattern actually reflected an independent migration, and was not a statistical artifact.
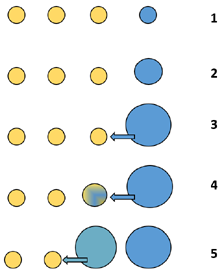
Gene flow, along with genetic drift, typically generates isolation by distance patterns, whereby genetic distances between populations increase with their geographic distances. However, by itself gene flow does not necessarily generate gradients or clines, especially over such a broad range as an entire continent. A more complex model was necessary to account for the observed continent-wide pattern. Schematically, the Neolithic demic diffusion model [9] first required the existence of initial genetic differences between the expanding farming population and the hunting-gathering populations occupying the areas of expansion, otherwise there would be no apparent effect of gene flow at the genetic level. Second, because of the new subsistence technology, more resources became available to the farming population so that it grew in size. Third, once the carrying capacity of the territory had been reached, the population would disperse in search of new arable land; this dispersal process was envisaged as a gradual phenomenon, rather than as a long-range, mass migration. Fourth, in the newly expanded territories, farmers and hunter-gatherers coexisted for some time without admixing. The farming component of the population kept growing, while the hunting-gathering component did not, so when the carrying capacity of the new territory had been reached, prompting a further dispersal, the dispersing group would contain a majority of people descended from Near Eastern farmers, and a minority of descendants of local hunter-gatherers. Under this stepping-stone model of population structure, the process would generate broad clines encompassing a vast territory (Figure 4).
Alternative models and methodological issues
An immediate consequence of this paper was the creation of a successful neologism, paleogenetics [13]. As of July 2021, Scopus reported 437 citations of the paper, generally positive with some enthusiastic comments; but some questions had arisen. Are we sure that the observed clines do not reflect selection, rather than population growth and dispersal? Clines do not carry a date, so could other prehistoric or historic migrations lead to the same results? Other comments had to do with methodological issues, such as the effects of interpolation and the possibility that PCA identifies patterns even where they do not exist.
The possible effects of selection were addressed mainly by simulation and analogy with patterns observed at single loci [14]. In general, although it is notoriously difficult to prove or disprove selection by analyzing allele-frequency variation, the opinion prevailed that selection should affect specific loci, and not multiple loci on different chromosomes [2,15]. Rather, some simulation studies showed that European allelic diversity was also consistent with distributions generated by replacement of hunter-gatherers by expanding farmer populations, where clines resulted from repeated founder effects during the expansion [16,17]. This observation led to questioning whether processes other than demic diffusion, or occurrences in periods other than the Neolithic, could provide an explanation for the observed clinal patterns.
The strongest challenge to the model of Neolithic demic diffusion came from an emerging research field, phylogeography. As mitochondrial DNA data became available and then abundant, building haplotype networks became a popular approach, as well as the more or less arbitrary clustering of haplotypes into ‘haplogroups’. Under two very strong simplifying assumptions, the networks returned information that was regarded as inconsistent with major effects of Neolithic processes. Following Richards et al. [18], the assumptions were: (1) each cluster in its entirety could be assigned to one of the main migration phases, Neolithic or Paleolithic; (2) the age of each cluster (i.e., its coalescence time) closely approximated the timing of the migration event. In other words, under assumption 2 the occurrence of a mutation is followed by a migration that will spread the new allele over the geographical space. In this way, phylogeographic analyses systematically estimated all migration phenomena at earlier times. In particular, every European haplogroup but one (J) had a coalescence time greater than 9000 years. This led to the proposal that the spread of agriculture was mostly an indigenous development (for an interpretation of the archaeological record under this view, see e.g., [19]) and that the European population structure was established in Paleolithic times (see e.g., [20,21], and, for the Y chromosome, [22]). In particular, haplogroup H was regarded and heralded as the molecular signature of Paleolithic Europeans [23]. In the phylogeographic literature, no attempt was made to reconcile these results with the clines observed in protein variation, but a cline of mitochondrial diversity matching the cline described in Menozzi et al.’s first PC was actually identified, which was more significant in the southern part of the continent than in the northern part [24].
The conclusions of the phylogeographic studies rested crucially on the assumption that the date of a migration can be regarded as the coalescence time of a cluster of mitochondrial DNAs. This view overlooked a key basic concept, that a mitochondrial mutation is a biochemical change affecting an egg cell in a woman, whereas a migration is a demographic process affecting many people. Rigorous application of these principles leads to nonsense. Mitochondrial haplogroup U, and hence the entire mitochondrial genealogy, predates the arrival in Europe of the first anatomically modern humans [18], which can only mean that the relevant mutation occurred when the Europeans’ ancestors lived somewhere else. It is now clear that the average coalescence time of two sequences sampled from two diverging populations is much older than the split of the groups [25]. Unless a group colonizing a new territory passes through a radical bottleneck, it will keep part of its initial genetic diversity. Therefore, the coalescence times inferred from samples of its descendants will be close to the coalescence times of the population of origin, consistently overestimating the age of the derived populations [26]. In short, people, not haplogroups, migrate [27]; hence, inferences about population history require clear models that consider demography and the effects of sampling, not just measures of genetic diversity between molecules [28–30]. Analyses of ancient DNA have now disproved the interpretations put forward in phylogeographic studies, incidentally showing that it was the Neolithic demic diffusion that introduced haplogroup H in Europe [31].
Other criticisms concerned the application of PCA to spatial data, which by their nature show some degree of autocorrelation. Simulation studies showed that mathematical artifacts might indeed arise, raising the possibility that clines in PCs may not necessarily reflect specific migration events. For instance, a tendency of the second PC to be orthogonal in space to the first PC was noted [32]. In addition, PCA results seem to be affected by the distribution of sampling locations. Interpolation generates local gradients of allele frequency, and it is unclear to what extent the broad gradients observed at the continental level reflect artificial, local ones [32–34]. In contrast, McVean showed that PCA applications in population genetics had a solid foundation, because evolutionary phenomena leading to various patterns of genetic diversity in space, such as the presence or absence of gene flow, result in different shapes of the genealogical tree and in different PCA results [35]. The main problem seems to be that in PCA analysis (and not only there), different processes may eventually produce the same pattern, making interpretation of the results equivocal. In this, as in many other instances, conclusions based on descriptive statistics need to be supported by explicit comparisons with alternative hypotheses [16,30,36–38].
We can safely say that, like any other statistical tool, PCA requires assumptions, which may be more or less justified in the context of the particular scientific questions being addressed. We are now more aware of several limitations of the approach; despite all that, it is remarkable that PCA has become an indispensable (we might say, inevitable) tool for exploratory analysis of population-genomic data [39, 40]. This is even more remarkable in light of the fact that the sheer amount of genomic information now available makes PCA less effective than it was for describing allele frequencies. PC1 and PC2 of Menozzi et al. accounted for 45% of the overall variance, whereas in modern genomic studies values around 3% are considered satisfactory. As we know, it is not a good idea to draw strong conclusions from a single study based on a single method. However, Menozzi et al.’s main conclusion, now more accurately qualified in the light of later findings in archaeology and genetics, is still essential to an understanding of the prehistorical phenomena that led to the establishment of the European population structure. Its strongest confirmation comes from the abundant body of ancient DNA data.
The Neolithic Demic Diffusion Today
The main difference between what we know (or think we know) today and what was known when the model of Neolithic demic diffusion was put forward depends not only on the enormous amount of genomic information now available, but also on our knowledge of past genetic diversity. Ancient DNA has revolutionized the field, allowing us to study directly what once could only be investigated indirectly.
Let us not forget that the typical difference between two randomly selected human genomes is around 20 million base pairs [41], i.e., 0.3% of the total 6.5 billion base pairs. All the following considerations will then refer to that small, variable fraction of the genome. Schematically, it seems that the oldest Eurasians studied at the genomic level, 45,000 to 37,000 years ago, did not contribute to the genetic diversity of present day people in Europe [42]. The first specimens clearly showing a shared ancestry with modern Europeans belong to the period between 37,000 and 14,000 years BP, and appear to be descended from a single founder population, which separated from East Asians 45,000 to 55,000 years BP [42,43]. Around 14,000 years ago, a major population turnover occurred, where most of the previous Paleolithic people in Europe were replaced by a population of hunter-gatherers sharing common genomic features, now referred to as western hunter-gatherers, or WHGs [42,44,45]. With the Neolithic transition, ancient DNA studies record the spread all over Europe of a new genomic component related to modern populations from the Near East [44,46]. The ability to recover nuclear DNA even from highly damaged samples, allowed ancient DNA studies to identify the main source of this early Neolithic component in early farmers from northwest Anatolia or the east Anatolian fault (EAF) [47,48] and, ultimately in ancient populations from the southern Levant and Iran [48,49].
A later migration movement starting some 5000 years ago in the Bronze Age, from the Pontic-Caspian steppes, led to the diffusion of the steppe, or Yamnaya (YAM) genomic features in central and northern Europe [50,51]. These were apparently a mix of Eastern and Caucasian hunter-gatherers that included a genomic component from Iranian farmers. Most European genomes, both ancient and contemporary, can be modeled as a combination of WHG, EAF and YAM components [51], although in specific zones the composition of the population and its history are somewhat different [52,53]. For instance, the YAM component is virtually absent in many areas of southern Europe [54]. The EAF and YAM components show two opposite clines, with the former reaching its maximum in southern Europe (90% in Sardinia) and its minimum in the Baltic area (10% in Estonia). Symmetrically, the genome component attributed to YAM has a maximum in Norway (>50%) and a minimum in Sardinia (<5%). The WHG component is scantily present all over the continent, never reaching values >15%, except in Estonia and Lithuania [51]. These results support a view of European genomic evolution in which the first hunter-gatherers left significant, but small, traces in various populations. At later times, two major migrations brought in the main genomic components. First, there was the demic diffusion of early Near Eastern farmers at the beginnings of the Neolithic; later, in the Bronze Age, pastoralist Yamnaya people came from the Ukrainian steppes, people whose ancestors were likely affected by a northward Neolithic diffusion from Anatolia or Iran [55]. The effects of Neolithic and Bronze Age migrations appeared in several diachronic studies of European populations [39], and match beautifully with the patterns described by Menozzi et al. in their PC1 and PC3. Modern genomic analyses show how deep was Menozzi et al.’s insight into the demographic history of Europe, despite the minimal amount of data they could analyze.
Recent studies showed that demographic growth in what would later become the farming populations started long before the Neolithic, suggesting that farming might have been a consequence of increasing numbers of people to feed, rather than its cause [56]. The geographical details of the early Neolithic farmers’ expansion in Europe are now beginning to be recognized in finer detail, both along a maritime route and through the traditional terrestrial lines of expansion [57]. In short, although it is often useful to schematically oppose alternative hypotheses, demic diffusion was the main, but not the only, process leading to the spread of agriculture in Europe. Different phenomena, both demographic and cultural, were probably important in different regions and at different times [58], and can now be dissected and carefully described by multidisciplinary studies of genetic, fossil and archaeological evidence. An archaeological study of the Neolithic transition phase across Europe seems to support the idea that the spread of Neolithic cultures was essentially a migratory process in the south, but not so much so in the north of Europe, where continuity of pre-Neolithic body ornaments across the Neolithic transition was observed [59].
Historical linguistics is also a potentially important component of the multidisciplinary effort to understand our prehistory (see Giuseppe Longobardi’s contribution). Another effect of Menozzi et al.’s study was to start a debate on the relationship between genetics and linguistics. Traditional linguists and archaeologists tend to identify the first Indo-European speakers with steppe pastoralists from the current Ukraine, who dispersed during the Bronze Age [60,61]. By contrast, after a careful comparison of archaeological, linguistic, and genetic evidence, Colin Renfrew [11,62] proposed that it was the early farmers from the Near East who introduced their language, an early form of Indo-European, into Europe, along with their new subsistence technologies and their genes. I shall not get into the details of this controversy here, although the absence of the YAM component in Bronze-Age, Indo-European-speaking, populations of Greece [54] seems hard to reconcile with the view that the first Indo-European speakers entered Europe from the north in the Bronze Age (as in Ref. 51). Rather, I would like to stress that Colin Renfrew’s proposal, besides being well supported by analyses of Indo-European vocabularies by the methods of evolutionary biology [63], offers an answer to another, final question I have not mentioned. Why did the first Near Eastern farmers move northwest, and not in other directions? If Colin Renfrew’s [62] views are correct, the simple answer would be that east and south of where they lived there were other early farming communities, who, more or less at the same time, were similarly growing in numbers and expanding where they could, eastwards and southwards, leading to the spread of other language families. To the best of my knowledge, this hypothesis has never been tested using genomic data. However, it successfully predicted Eurasian patterns of genetic diversity when all we had to study was a handful of protein polymorphisms [64].
Declarations
Competing Interests
Guido Barbujani is the Editor-in-Chief of the journal Human Population Genetics and Genomics. He was not involved in the review or decisions related to this manuscript.
Acknowledgement
I thank Paolo Menozzi and Alberto Piazza for the permission to reuse photographic material from their 1978 paper, and Lounès Chikhi and Gloria González-Fortes for many suggestions and critical reading of the manuscript.