
Green Energy and Sustainability ISSN 2771-1641
Green Energy and Sustainability 2026;6(2):0005 | https://doi.org/10.47248/ges2606020005
Original Research Open Access
Investigation of the charging of a latent-heat storage tank with encapsulated erythritol for concentrating solar systems
Nikolaos Papadimitriou

 ,
Vassilios Belessiotis
,
Elias Papanicolaou
,
Vassilios Belessiotis
,
Elias Papanicolaou
Correspondence: Elias Papanicolaou
Academic Editor(s): Tony Roskilly, Georgios Martinopoulos, Georgia Kastrinaki, Hande Eryilmaz, Martin Roeb
Received: Oct 31, 2025 | Accepted: Apr 28, 2026 | Published: May 13, 2026
This article belongs to the Special Issue Selected Papers from the Conference ICRES 2025
© 2026 by the author(s). This is an Open Access article distributed under the Creative Commons License Attribution 4.0 International (CC BY 4.0) license, which permits unrestricted use, distribution and reproduction in any medium or format, provided the original work is correctly credited.
Cite this article: Papadimitriou N, Belessiotis V, Papanicolaou E. Investigation of the charging of a latent-heat storage tank with encapsulated erythritol for concentrating solar systems. Green Energy Sustain. 2026;6(2):0005. https://doi.org/10.47248/ges2606020005
This work concerns thermal energy storage in the medium-temperature range (100 – 250 °C), which is typical of parabolic-trough concentrating solar power (CSP) systems. Within this context, the use of phase change materials (PCMs) has been drawing attention in recent years as a promising technology. A class of PCMs suitable for the specific temperature range are sugar-alcohols and, among those, meso-erythritol (melting point: 118 °C) has been selected here as a such representative compound. Both experimental and computational methods are being used, whereby the experimental part of the work is carried out in a pilot facility, which is a hydraulic loop integrating a 100 L cylindrical storage tank. This is loaded with 200 hollow spherical containers (capsules) of 7.5 cm diameter made of steel, containing the PCM and forming a packed-bed arrangement. This offers a large surface area allowing for good heat transfer between the storage medium and the circulating heat transfer fluid, which is here a thermal oil (Therminol). For the computational work, a packed-bed model is used, considering the tank as a porous medium consisting of two phases (fluid and PCM) thermally interacting with each other and the continuous solid phase approach is used for the PCM, with suitable treatment of the phase-change in the energy equation. The model is validated and used for comparisons with preliminary experiments for the charging of the tank showing good agreement. Subsequently, a parametric investigation is carried out based on the model, by considering additional values of the main thermal-hydraulic parameters, such as oil flow rate and inlet temperature, and their effect on the melting rate and the charging efficiency are investigated. For a period of 8 hours, typical of a daily cycle of operation of a solar energy system, the evolution of the phase change process is evaluated from the numerical results for all parameters considered. It is shown for which values of these parameters the melting process can not be completed within the chosen time period and, thus, careful selection is needed when designing a storage system based on the given storage concept for optimum utilization of the harvested solar energy.
Keywordsthermal energy storage, latent heat, phase change material, packed-bed, erythritol
Thermal Energy Storage (TES) offers several advantages compared to the most common electrochemical storage methods (batteries) when several factors such as performance, environmental impact, durability, reliability, lifecycle costs, etc., are taken into account [1,2]. The medium-temperature range has been identified as one of great potential interest, especially for industrial processes many of which have a heat demand in the area of 120 °C–260 °C and one for which limited attention has been paid so far [3,4]. Besides, this range is of interest in power generation based on low- and medium-temperature Organic Rankine Cycle (ORC) systems [5].
For these applications, latent heat thermal storage materials offer advantages, such as isothermal phase change and a high storage density [3]. The low-temperature range of applications for these materials has been widely studied, with emphasis on paraffin as the phase-change material [6,7]. With regard to the range of low-to-medium temperatures, sugar alcohols have been found to be good candidates as storage media, exhibiting much higher latent heat of fusion ΔHm (up to 350 kJ/kg) as compared to the rest PCMs with close melting points range, and their melting points cover a wide temperature range [8]. A fairly large number of studies has been devoted to the study of these organic materials (also known as polyols) and the characterization of their thermophysical properties and stability [9–13]. Their advantages include the relatively low price, non-toxicity, non-flammability, non-corrosivity, and low environmental impact [13], as well as the fact that they can be sourced from renewable feedstocks [2]. There are, however, also some disadvantages, such as low thermal conductivity, from which most types of PCM suffer, as well as significant supercooling (or subcooling, i.e., delayed start of solidification upon cooling) [14], thus research efforts have been undertaken in recent years aiming at overcoming these problems by means of suitable additives (high conductivity particles, nucleating agents etc.) into the material [15]. The most widely studied sugar alcohols as storage materials so far are (with their respective melting points) xylitol (95 °C), D-sorbitol (97 °C), erythritol (118 °C) and D-mannitol (167 °C). A summary of applications of the aforementioned materials has been presented by Tomassetti et al. [11], with regard to their thermal performance when used in latent heat storage systems.
Among these materials, erythritol was selected in the present study, due to its higher latent heat value and the compatibility of its melting point with medium-temperature concentrating solar systems. Several studies have been presented in the literature, characterizing erythritol in terms of its thermophysical properties, but also evaluating the performance of erythritol by experimental and numerical methods in various applications. The most common configuration was the heat exchanger, of the shell-and-tube type in particular [11]. Agyenim et al. [16] considered a horizontal, concentric-tube heat exchanger and in a subsequent study [17], a multi-tube system, consisting of four HTF-carrying tubes. They found an improved heat transfer rate during charging but observed also large subcooling. Wang et al. [18] investigated a flexible heat transporting system, called ‘mobilized thermal energy storage system (MTES)’ for industry heat recovery, employing a direct-contact, cylindrical storage unit, consisting of 50% erythritol at the bottom and 50% of heat transfer oil placed at the top. In a later study, Wang et al. [19] studied also the discharging of the same unit by numerical simulation and analyzed the behavior of the system during solidification of erythritol and the effect of oil flow rate and inlet temperature.
In a different configuration, a double spiral coil energy storage unit, Anish et al. [20] experimentally analyzed the performance of erythritol, by focusing on performance parameters such as energy storage and discharge rate, liquid fraction, HTF (thermal oil) outlet temperature variation, charging and discharging time and the effect of the HTF flow rate and inlet temperature. In a subsequent study [21], Anish et al. studied a horizontal shell and multi-finned tube system by numerical methods. They varied the number and geometric parameters of tubes and fins and studied their effect on the natural convection effects and the melting process. A shell- and helical-tube heat exchanger configuration was experimentally investigated by Mayilvelnathan and Valan Arasu [15]. Their particular focus was on the enhancement of thermal conductivity of erythritol by dispersing graphene nanoparticles. Improvements up to 20% were observed in the charging and discharging times of the storage unit with the addition of 1 wt% nanoparticles. Several applications of erythritol related to solar energy have also been reported, particularly its use in improving the thermal performance of evacuated-tube collectors [22,23], and as storage medium in solar cookers [24] among others.
The configurations for placing the PCM in the storage unit can generally be classified into two types: tank PCM and encapsulated PCM (EPCM) [25]. In the former case, the PCM fills the entire volume of the tank, and the heat transfer fluid (HTF) flowing through carries the heat in (charging phase) or out (discharging phase) of the storage medium, by means of a heat exchanger. This approach suffers from poor heat transfer rates, particularly in the case of discharging when the PCM starts solidifying next to the heat exchanger tubes, thus offering increased thermal resistance at that location. The encapsulation, on the other hand, aims, among others, at providing a large surface area for heat transfer between the HTF and PCM.
Packed beds belong to the class of passive TES systems, as the storage medium is a stationary solid (or a PCM), and the HTF passes through the storage material only for charging and discharging [26,27]. They normally consist of a single tank where the storage medium is placed as a filler material (solid or PCM) and the HTF flows through the tank making direct contact with the storage medium. In these single-tank configurations, hot and cold fluid are maintained within the same tank, with a thermal gradient zone in-between, the thermocline, thus these are also called thermocline storage [28].
Several studies may be encountered in the literature related to packed bed latent heat storage systems [25,26,29], at different temperature levels. In medium-temperature applications, however, where oil is used as the HTF as in the present study, a limited amount of work is available. With regard to experimental works, in particular the first such studies were those presented by Beemkumar et al. [30–32], who used Therminol-66, or Therminol-55 as HTF and two sugar alcohols, namely D-Sorbitol and D-Mannitol. In the first of the series, their experimental setup included a Parabolic-Trough Collector (PTC) coupled with a cylindrical storage tank and a circulating pump [30]. In a later study, they also investigated the effect of fins on the spheres and different encapsulation materials.
With regard to encapsulated erythritol, which is the PCM of interest in the present study, experimental studies were conducted by Shobo & Mawire [33] and Mawire et al. [34] considering individual capsules and comparatively assessed the behavior of four different PCMs, among them erythritol, with melting points in the range 110 °C-185 °C, encapsulated in spherical aluminum capsules, suspended in a pot filled with sunflower oil and heated by an electrical hot plate. Erythritol exhibited the best performance at charging, but its discharging performance was hampered by subcooling. As far as packed-bed configurations, the only study that included erythritol among the materials tested was the one carried out by Mawire et al. [35] the other two being adipic acid and eutectic solder (Sn63Pb67). Finally, there are also studies that have carried out numerical simulations of the melting and solidification of erythritol in single spheres [36,37], as well as cascade systems, combining erythritol with paraffin for waste-heat recovery applications [38].
From the literature survey, it may be concluded that very few studies have been so far carried out with latent heat storage in the form of encapsulated PCM at the medium temperature range, involving experimental measurements. The present study, in particular, considers a larger tank scale and a greater number of capsules than those reported in previous works, namely a 0.1 m3 cylindrical tank, with 200 spheres of diameter of 75 mm, with erythritol encapsulated in stainless steel. The behavior of the storage unit is characterized by measurements of temperatures at selected locations in the tank, and is combined with a numerical model for the packed bed configuration providing considerable details of the phase-change evolution during charging of the tank. The results can be valuable in the search of the optimal design of a latent-heat storage system for concentrating solar systems.
The PCM used in our experimental work is meso-erythritol (C4H10O4) 99 %, provided by Alfa Aesar. Thermal oil Therminol-SP is used as the HTF. Relevant properties of these materials are shown in Table 1 and 2.
Table 1. Properties of the PCM (meso-erythritol).


Table 2. Properties of the heat transfer fluid (Therminol-SP) in the range 20–150 °C (T in °C).
The main part of the experimental setup consists of a cylindrical tank (0.804 m height and 0.410 m diameter) with a net volume of 106 L. This size is larger compared to the previous works in the literature. Two conical diffusers on the sides of the cylinder ensure uniform inlet/outlet of the HTF. All parts are made of stainless steel SS304. The HTF is circulated by a 2.8 kW pump that provides flow rates up to 8000 L/h. All temperatures are measured with Pt100 resistance thermometers, with an accuracy level of 1/10 Class B (acc. EN 60751) and a 4-wire connection with an accuracy of ± 0.2 K. Mass flow rate is measured with a Coriolis flow meter with a maximum error of ±0.1%. The HTF is heated by a 36 kW electrical heater and cooled by an 8 kW air-cooler. The flow chart of the entire hydraulic loop is shown in Figure 1.
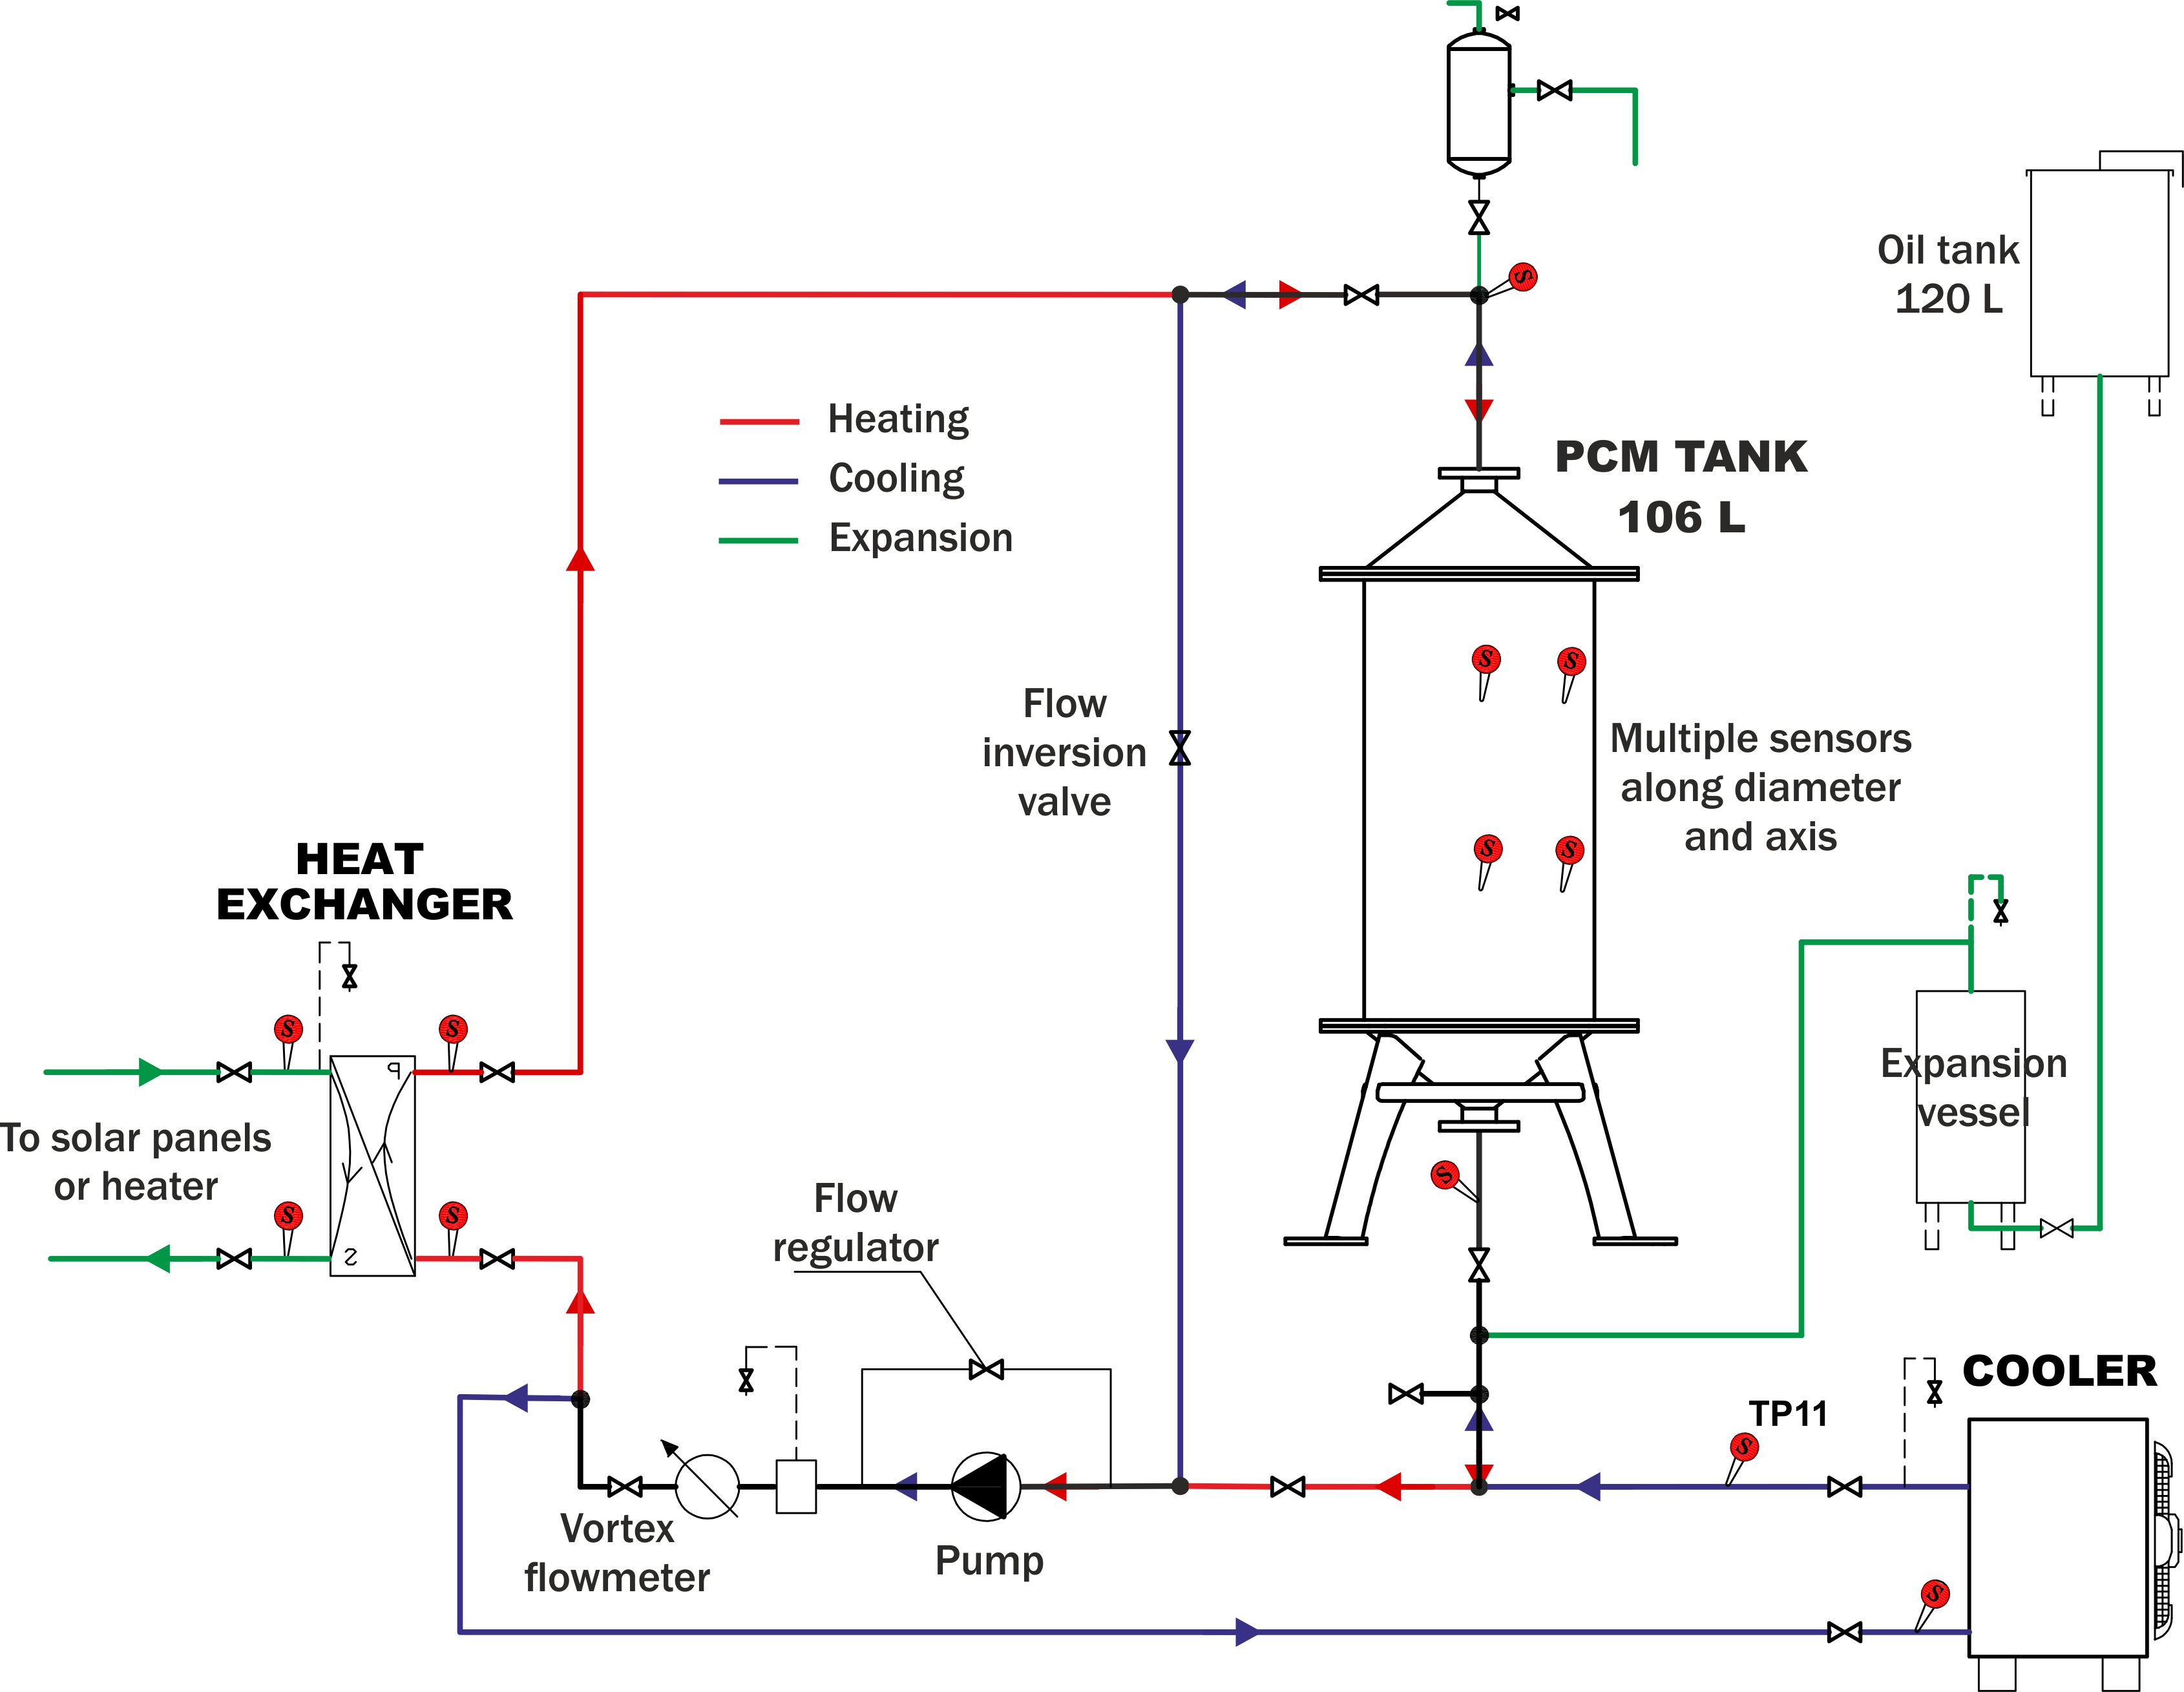
Figure 1. Schematic depiction of the overall hydraulic loop for the experimental evaluation of the latent-heat storage tank.
Erythritol is encapsulated in stainless-steel spheres of outer diameter 75 mm and wall thickness 5 mm. The tank is loaded with 200 such spheres that are randomly placed in the tank so as to form a packed-bed configuration (Figure 2). Each sphere is filled, through a hole, with 170 g liquid erythritol at 140 °C and the sphere is allowed to cool down to room temperature. Prior to loading in the tank, all spheres are tested for leakages by being heated in an oven at 140 °C for 4 h.
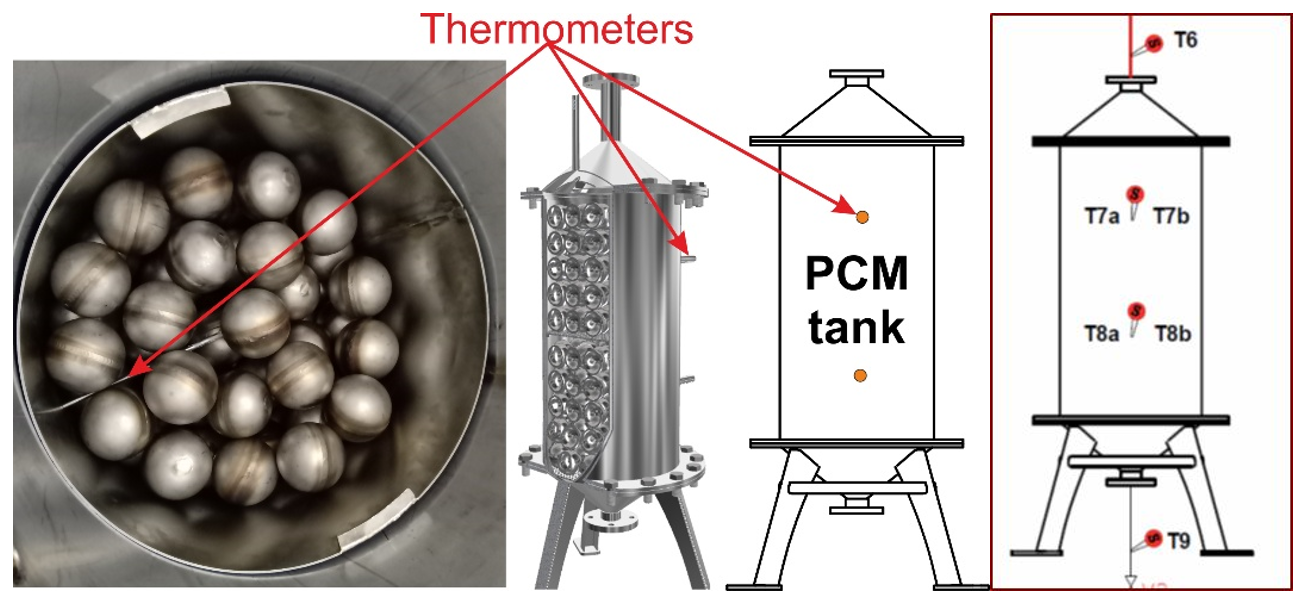
Figure 2. The experimental tank (left), the capsules containing the PCM (middle) and the thermocouple locations (T6-T9) for the temperature measurements.
The models available for packed beds have been presented by several authors, starting with Ismail & Stuginsky [39] and more recently by Esence et al. [40], Sebbar et al. [41] and Guo et al. [42], both for sensible and latent heat energy storage. The main distinction is between single-phase and two-phase models. They mostly use the energy equations of the phases involved, assuming uniform flow through the bed and the assumptions and simplifications made are a trade-off between the desired accuracy and the available computing power [40].
Here the continuous solid phase model is selected, belonging to the class of two-phase models. The general idea of formulating the computational domain from the real physical model of the tank is shown in Figure 3. A key parameter here is the void fraction (or bed porosity) ε, which is obtained after subtracting the volume of the spherical capsules from the total volume of the cylindrical bed.
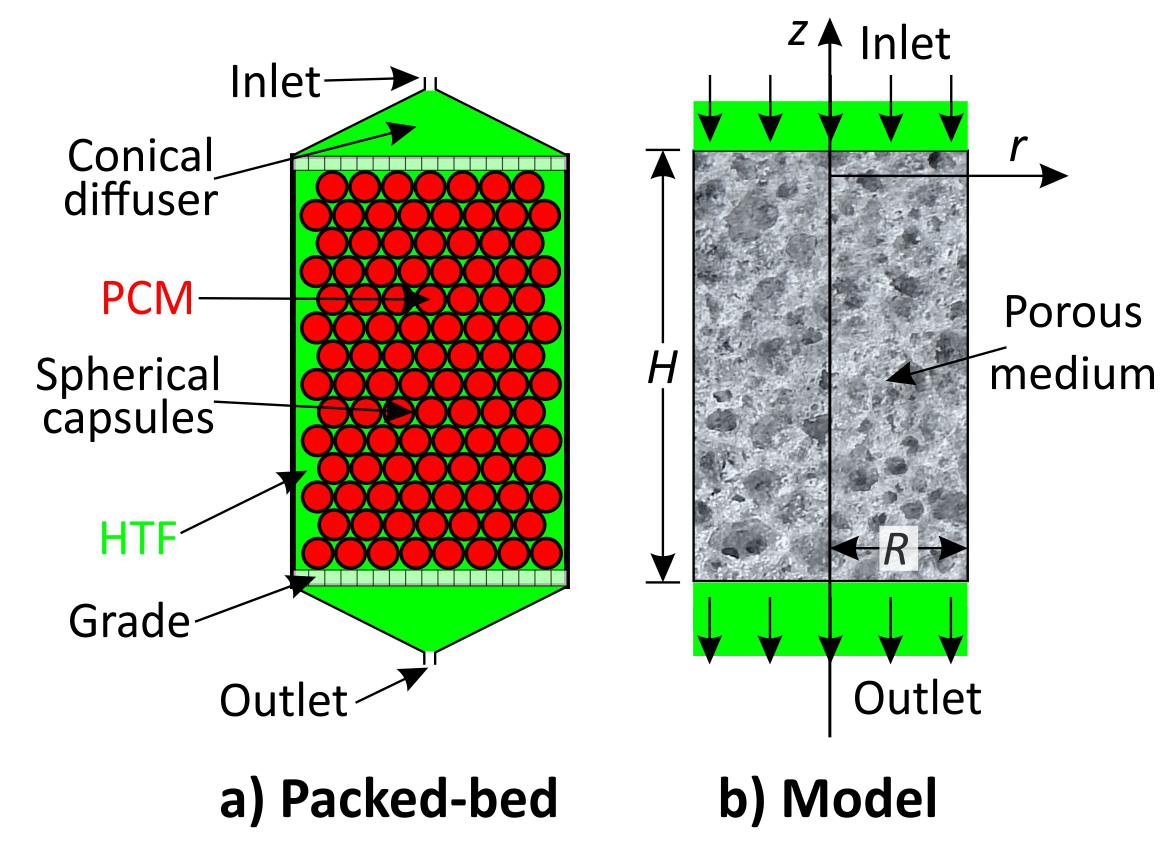
Figure 3. The formulation of the computational domain for the numerical model using the continuous solid phase approach.
The governing equations for this axisymmetric model, with axial coordinates x and radial coordinate r’ respectively, are as follows:
Heat Transfer Fluid
PCM
In the above equations, Cp is the specific heat, and k is the thermal conductivity, both referring to either the fluid or the PCM with the respective subscripts ‘f’ or ‘PCM’, similar to the temperatures. ΔH is the latent enthalpy of melting (J/kg) and the thermal conductivity is defined differently in each of the radial and the axial directions, as will be explained below. The main assumption in the above equations is that there is no thermal equilibrium between the two phases at each location (thus, such models are also called non-thermal equilibrium models) and the heat exchange is expressed by a heat transfer coefficient hsf to be obtained from correlations.
The melt (or liquid) fraction γ appearing in the last term of Equation 2 is defined as a function of temperature within each temperature range:
The two temperatures Tsol, Tliq (solidus and liquidus) define a narrow range about the melting point Tm, within which phase change actually takes place and here we consider a value of ± 2 °C.
Here we use the non-dimensionalization introduced by Ismail & Stuginsky [39] and define the following dimensionless parameters:
λ is a thermal capacity ratio (fluid/PCM), the parameter Г is analogous to the Number of Transfer Units (NTU), known from the analysis of heat exchangers and is actually referred to as such by some researchers. G is the superficial mass velocity, G = ρ · usup (kg s-1 m-2), with usup the superficial velocity, ap is the superficial particle area per unit bed volume (=6(1-ε)/dp for a spherical particle of diameter dp), while
Furthermore, the dimensionless space coordinates are X = x/H, r = r'/H, whereas for the time and velocity non-dimensionalization, the following characteristic scales are used:
where uint is the interstitial velocity, defined as uint = usup/ε. The dimensionless temperatures are defined in terms of the melting temperature Tm and the temperature difference (HTF inlet – initial in the tank): ΔT = Tf,in-T0 as follows:
With the introduction of these parameters, the non-dimensional temperature equations for the two phases can be written as:
Heat Transfer Fluid
PCM
The last term in the equation for the PCM involves the Stephan number, which is defined as:
With regard to packed beds with latent heat storage, there are three main approaches for the treatment of phase change, namely: the apparent heat capacity method, the heat source (or enthalpy-porosity) method and the radial diffusion method [41]. Here, the second approach is used, as implied by the presence of the last term in the equation for the PCM, involving the melt fraction γ.
The equations and dimensional parameters above involve the directional thermal conductivities of both materials
Then, based on this quantity an axial effective and a radial effective thermal conductivity may be respectively computed from:
The first term in the above definitions expresses the thermal conductivity for a stagnant fluid, whereas the second term the effect of motion in each direction. Rep is called the particle Reynolds number and is here based on the capsule diameter: Rep = Gdp/μ. The fluid effective thermal conductivity may be obtained for both directions from:
Then, the solid effective thermal conductivity is computed by subtraction from the respective effective values:
To calculate the heat transfer coefficient hsf, the following correlation of Wakao et al. for the Nusselt number, based on the capsule diameter (
At inlet (X=1) specified values of the temperature are imposed, constant or time varying, as will be discussed below. The non-dimensional velocity U is equal to 1, throughout the domain, as the momentum equation is not solved in this type of packed-bed models. At outflow (X=0), the axial derivative of the temperatures of both materials (HTF and PCM) is taken as zero. At the sidewall (r=0,25, since the aspect ratio of the tank H/D=2), a boundary condition may be specified by means of an overall heat transfer coefficient Uw which includes three components: internal (fluid-to-wall) heat transfer coefficient, conduction through the tank wall and convection from the external wall to the surroundings [39]. These can all be incorporated into a combined equation involving an equivalent Biot number Bir:
and with r0 the internal tank radius. This condition applies only to the HTF equation, whereas for the equation for the PCM an adiabatic boundary condition is used in the radial direction. Due to the good insulation of the tank, however, the Bir values turned out to be very small, thus an adiabatic condition for the HTF was found adequate as well in the cases considered here.
A finite-volume discretization is employed for the axisymmetric model of the computational domain shown in Figure 3, by first converting Equations 7 and 8 into the generic transport equation of the convection-diffusion form:
where ɸ stands for either θf or θPCM and Гɸ are suitable diffusion coefficients arising from the respective terms in Equations 7 and 8 (not to be confused with the coefficient Г in the source terms). The respective source terms are:
Equation 15 is then integrated over non-overlapping control volumes ΔV covering the entire computational domain and yields algebraic equations of the form:
where ɑi are discretization coefficients and the subscript p refers to the central computational node, whereas i = E,W,S,N stands for the neighboring nodes (east, west, south, north). A time-marching procedure is employed using the alternating-direction implicit (ADI) method [43]. The two temperature equations are solved sequentially, with a special treatment of the source term due to latent heat in Equation 16. More specifically, the heat source approach employed for the phase-change, involves an iterative procedure, as discussed by Sebbar et al. [41]. A guessed value of the melt fraction γ at each new time step is first computed, the PCΜ equation is then solved for the new temperature, then γ is computed again from the equation of its definition (Equation 3), the temperature equation is solved again and so on, until both PCM temperature and γ converged within a specified accuracy, e.g., 10-4.
Regarding the grid dimensions, 21 nodes along the radius and 61 nodes in the axial direction were used, a number which was found adequate for the conduction-dominated heat transfer problem treated here (momentum equations not solved). Other grid dimensions were also considered, more specifically a grid which is one level coarser grid (11 31) and two more levels finer than the one used in the paper (31 91 and 41 121) and selected quantities, global and local ones were compared. The difference between the present grid and the two finer levels were less than 0.5% for all quantities compared, therefore the 21 61 was found adequate. A time step of 1 sec was used in all computations.
For the validation of the model, suitable test cases with experimental results have been sought in the literature, the closest one being the packed-bed of Mawire et al. [35], which used the same PCM. The comparisons of the computed results with the present model and the experimental results of Reference [35] are shown in Figure 4, showing a very good agreement.
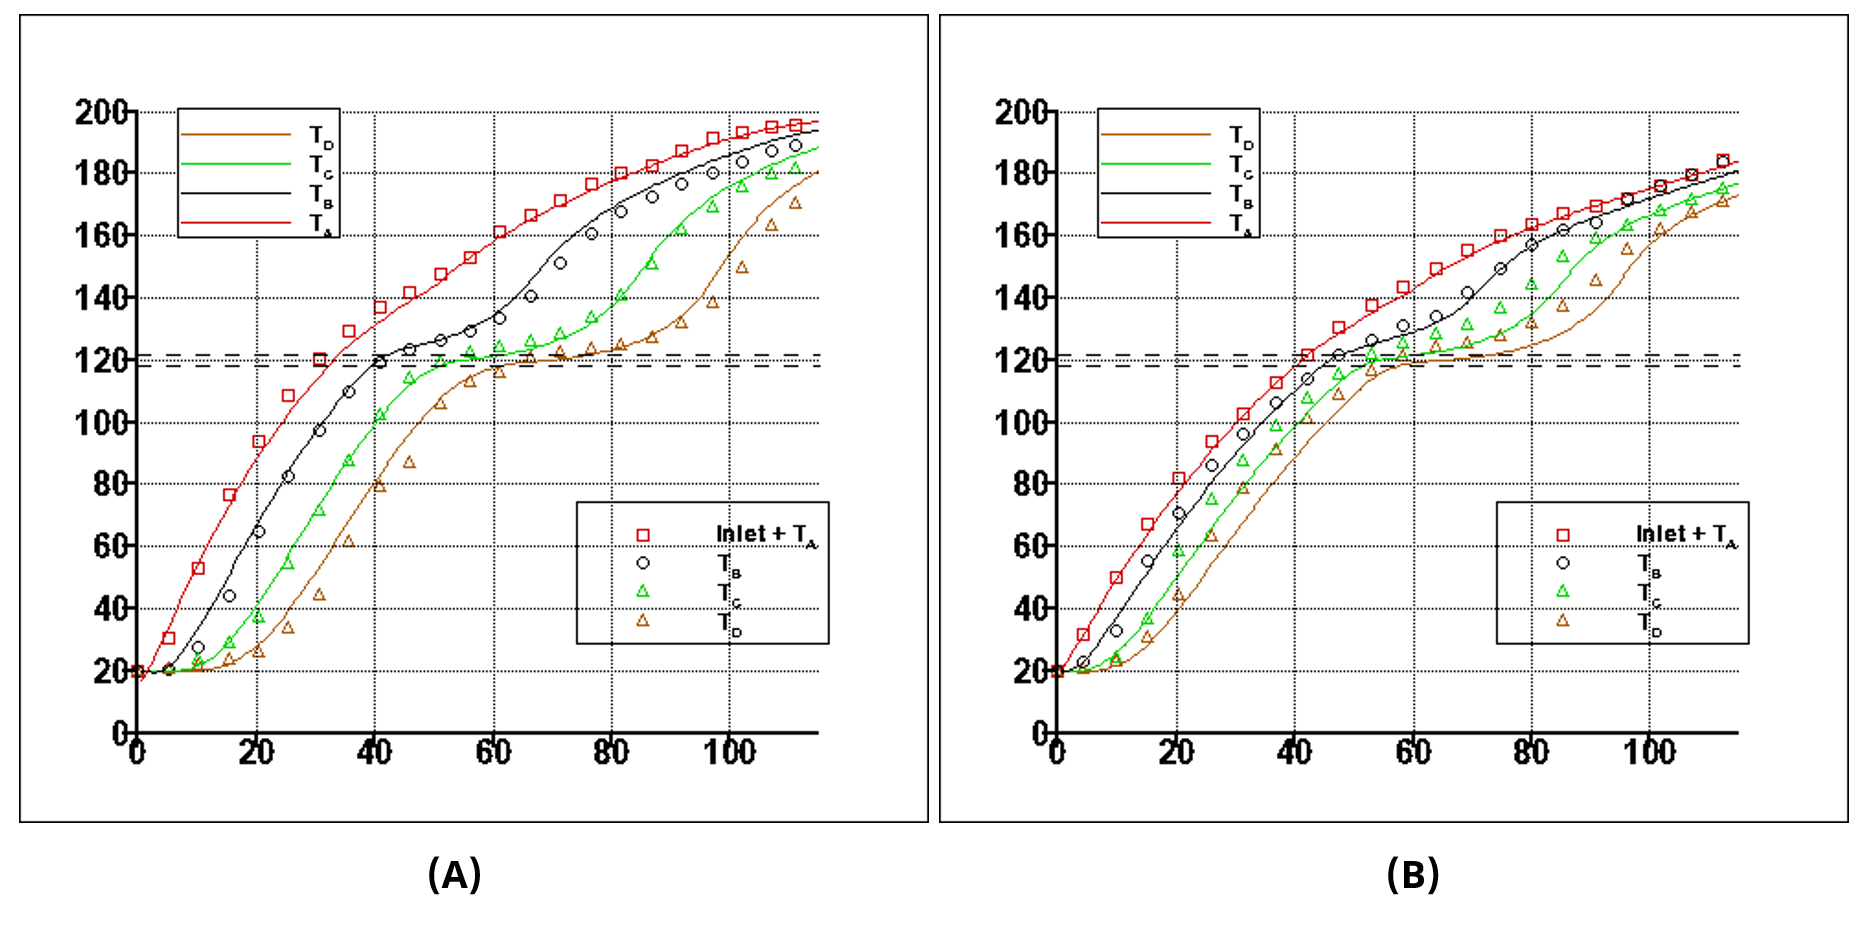
Figure 4. Model validation with the results of Mawire et al. [35], for charging of a packed bed using erythritol as PCM and sunflower oil as the working fluid. Flow rate: (A) 4 mL/s, (B) 6 mL/s. The lines are the computed results and the markers are the experimental data at various heights in the bed.
The first set of results obtained after the model validation is for the conditions of experimental measurements. The value of ε was estimated to be 0.55, whereas the particle Reynolds number for this flow rate was Rep = 5.56, and the interstitial velocity was 2.89 10-4 m/s. This was a test starting from the tank (both oil and PCM) at a completely uncharged state, i.e., at an ambient temperature of 32 °C, which is far below the phase transition temperature of erythritol. The inlet temperature of the HTF stabilizes at a temperature of 137 °C within a short time after starting the experiment. Comparisons between computed and measured values of temperature at various locations in the tank are shown in Figure 5. The agreement is quite satisfactory overall. The outlet temperature at the end of charging appears somewhat lower, which could be attributed to heat losses between the exit from the packed bed and the location within the cone where the respective thermocouple is located (T9a). In Figure 5B the agreement is quite good at a distance H/4 from the bottom (thermocouple T8a), whereas at 3/4 of the height (thermocouple T7a) the discrepancy between measured and computed values is an indication that the phase change is completed faster than the model predicts and sensible heating starts earlier.
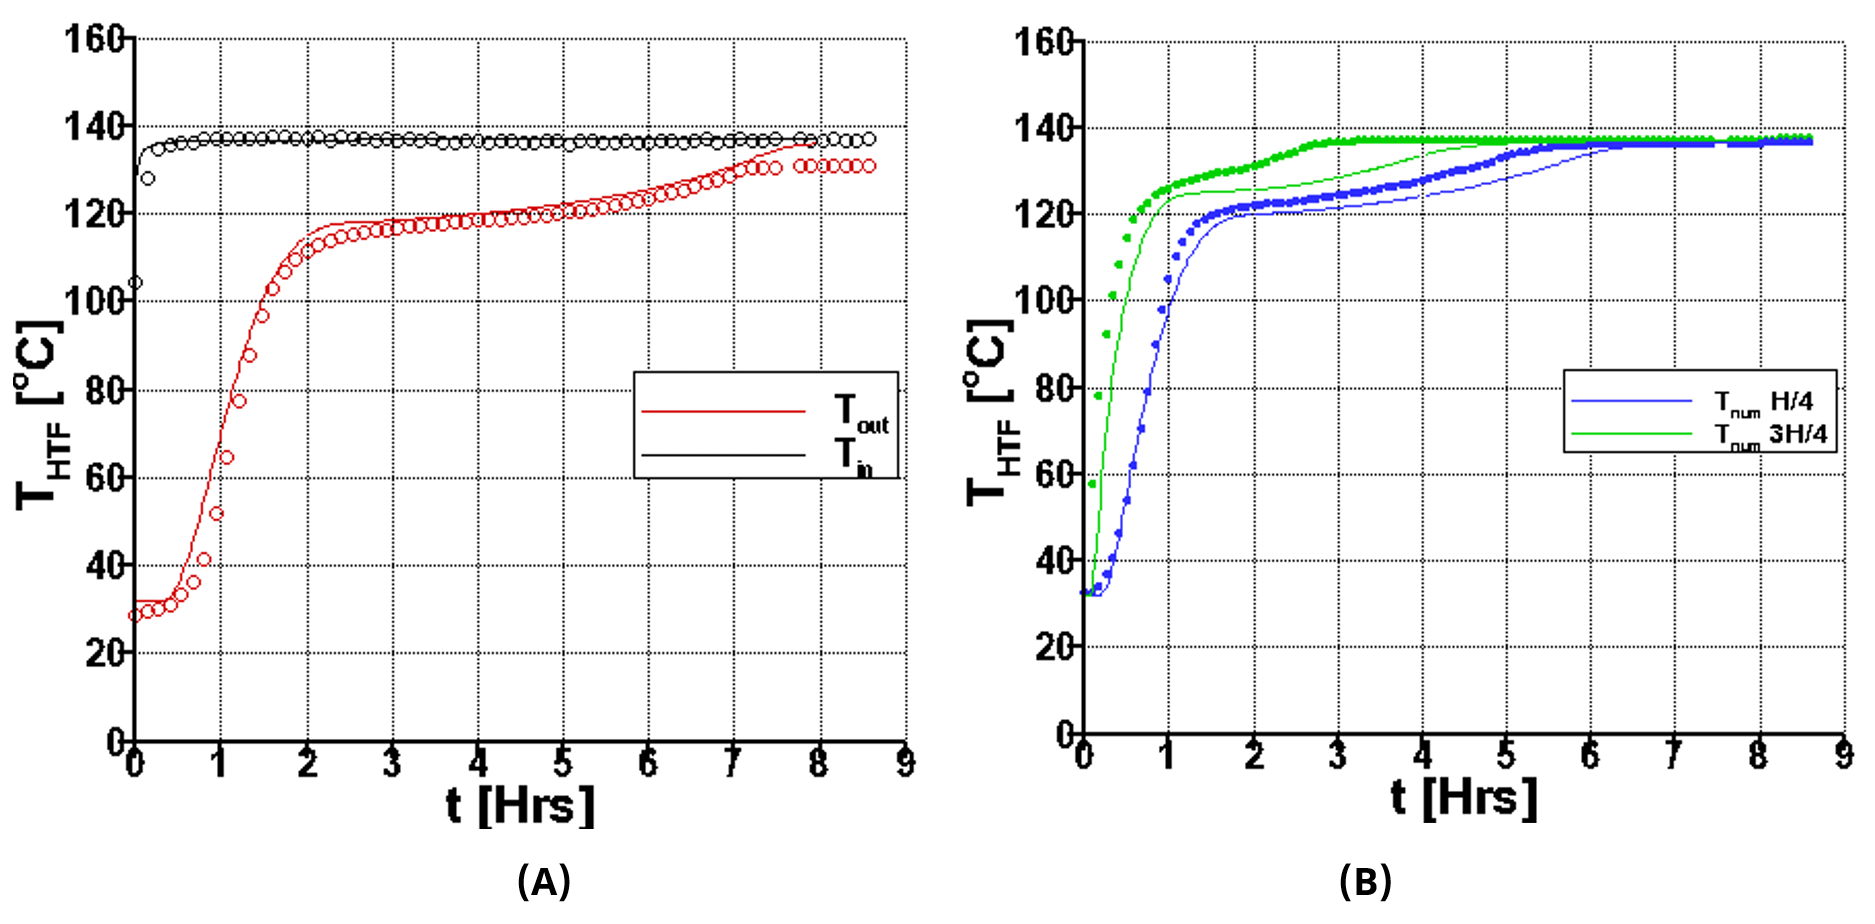
Figure 5. Comparison between experimental (solid line) and computational data (points). (A) Inlet and outlet HTF temperature; (B) oil temperatures at 1/4 and 3/4 of packed bed height.
In Figure 6, axial temperature distributions along the tank at different times are presented in dimensional form, with the vertical line at Tm indicating the melting point. Both HTF and PCM temperatures are shown, at time intervals of 12 min in Figure 6A and B and 24 min in Figure 6C. In the interval 0–2 Hrs (Figure 6A, bottom), it may be observed that the top layer of the PCM attains the melting temperature at about 24 min, time after which a melting front is shown to move downwards, with the temperatures remaining within the phase transition range, around the melting point (here ±2 °C), for most of the tank height as time proceeds. At around 2 hours, we can see that the melting has completed at the top layer and sensible heating of the PCM starts. In the subsequent parts, (B) and (C), it can be observed that gradually melting is completed at the lower layers of the PCM until all of them attain a uniform temperature which corresponds to the inlet temperature of 137 °C.
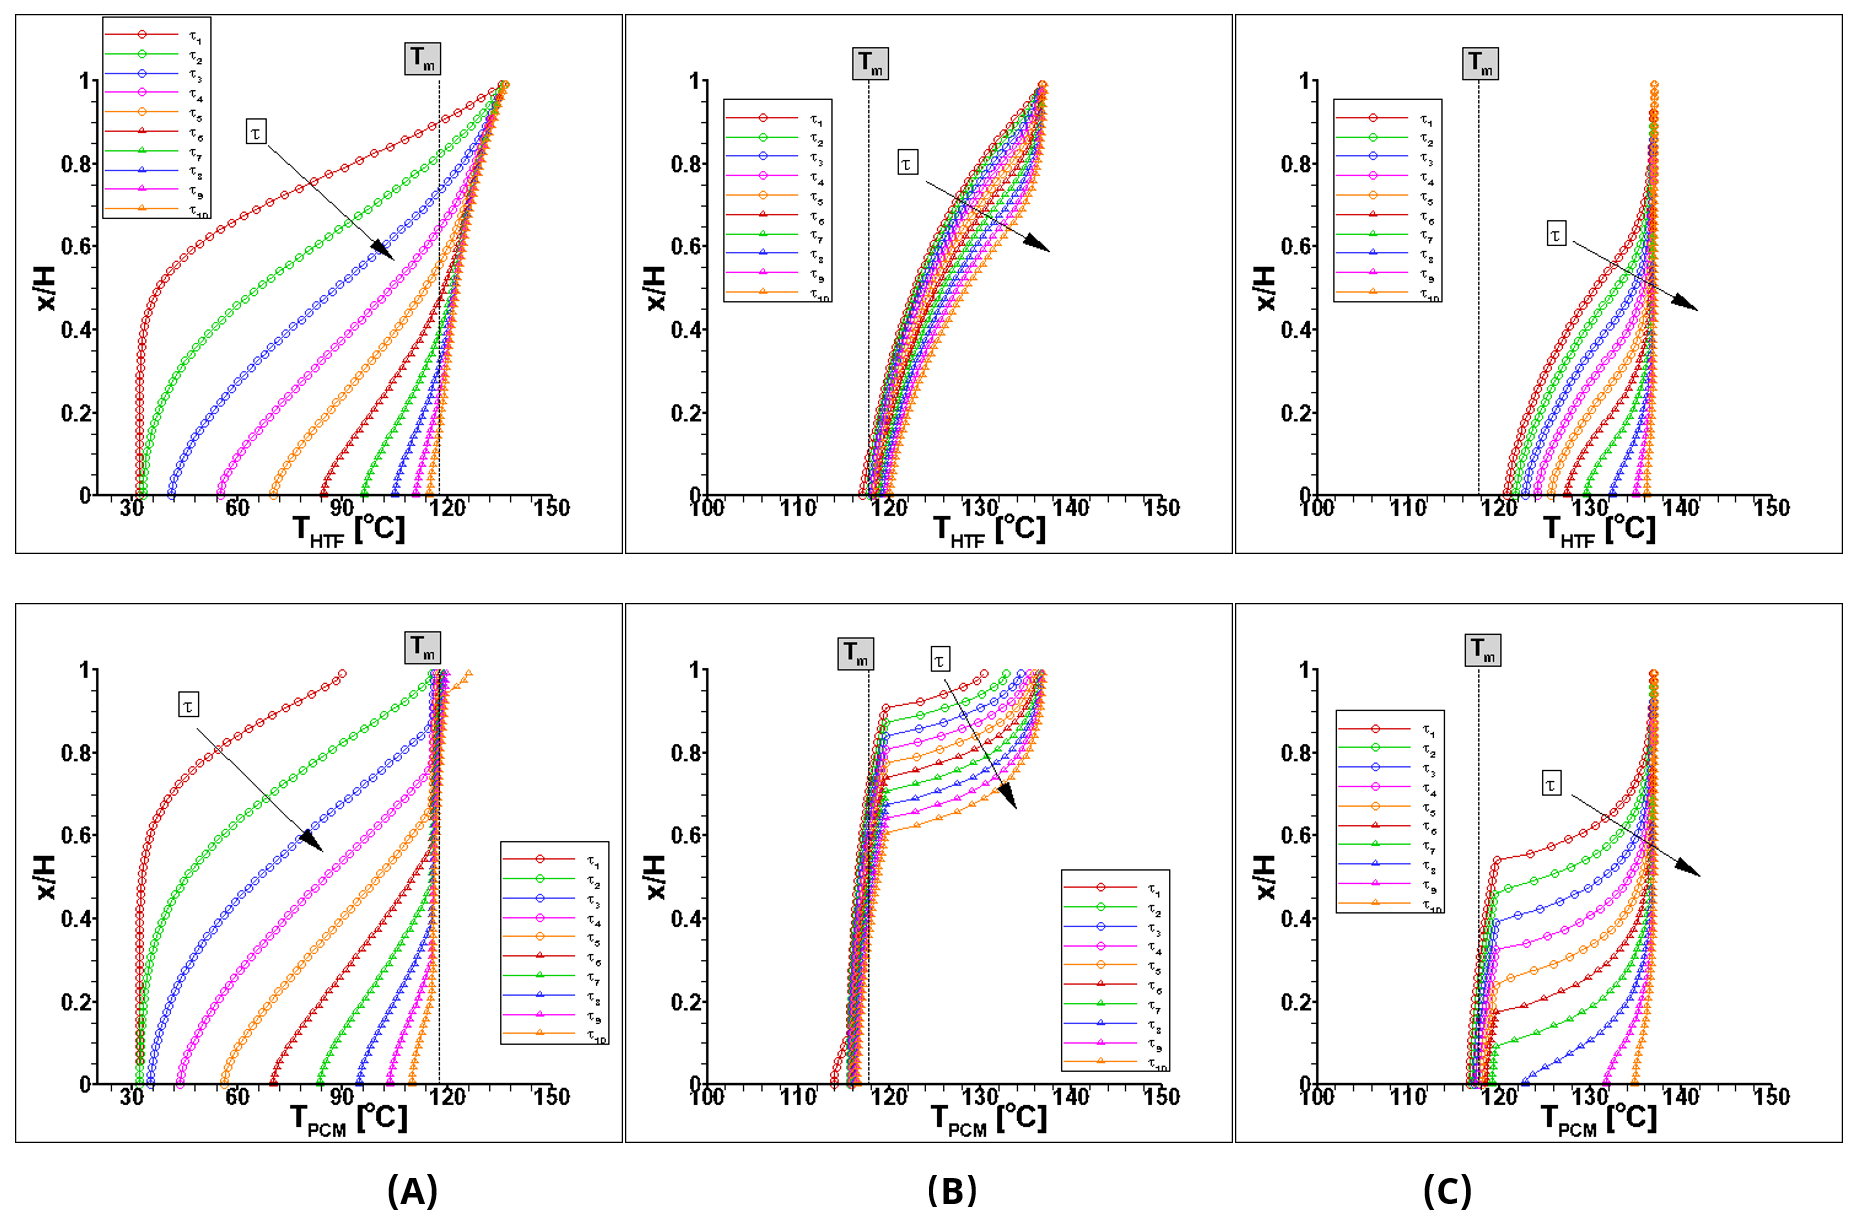
Figure 6. Axial temperature distributions [°C] at different dimensionless times τ1-τ10: HTF temperatures (top), PCM temperatures (bottom). (A) 0–2 Hrs (12 min intervals); (B) 2–4 Hrs (12 min intervals); (C) 4–8 Hrs (24 min intervals).
In Figure 7, the development of the melting process may also be realized in terms of the melting fraction, whose value is seen to increase from 0 as the melting front moves downwards, until all layers attain the value of 1 after a period of 8 hours.
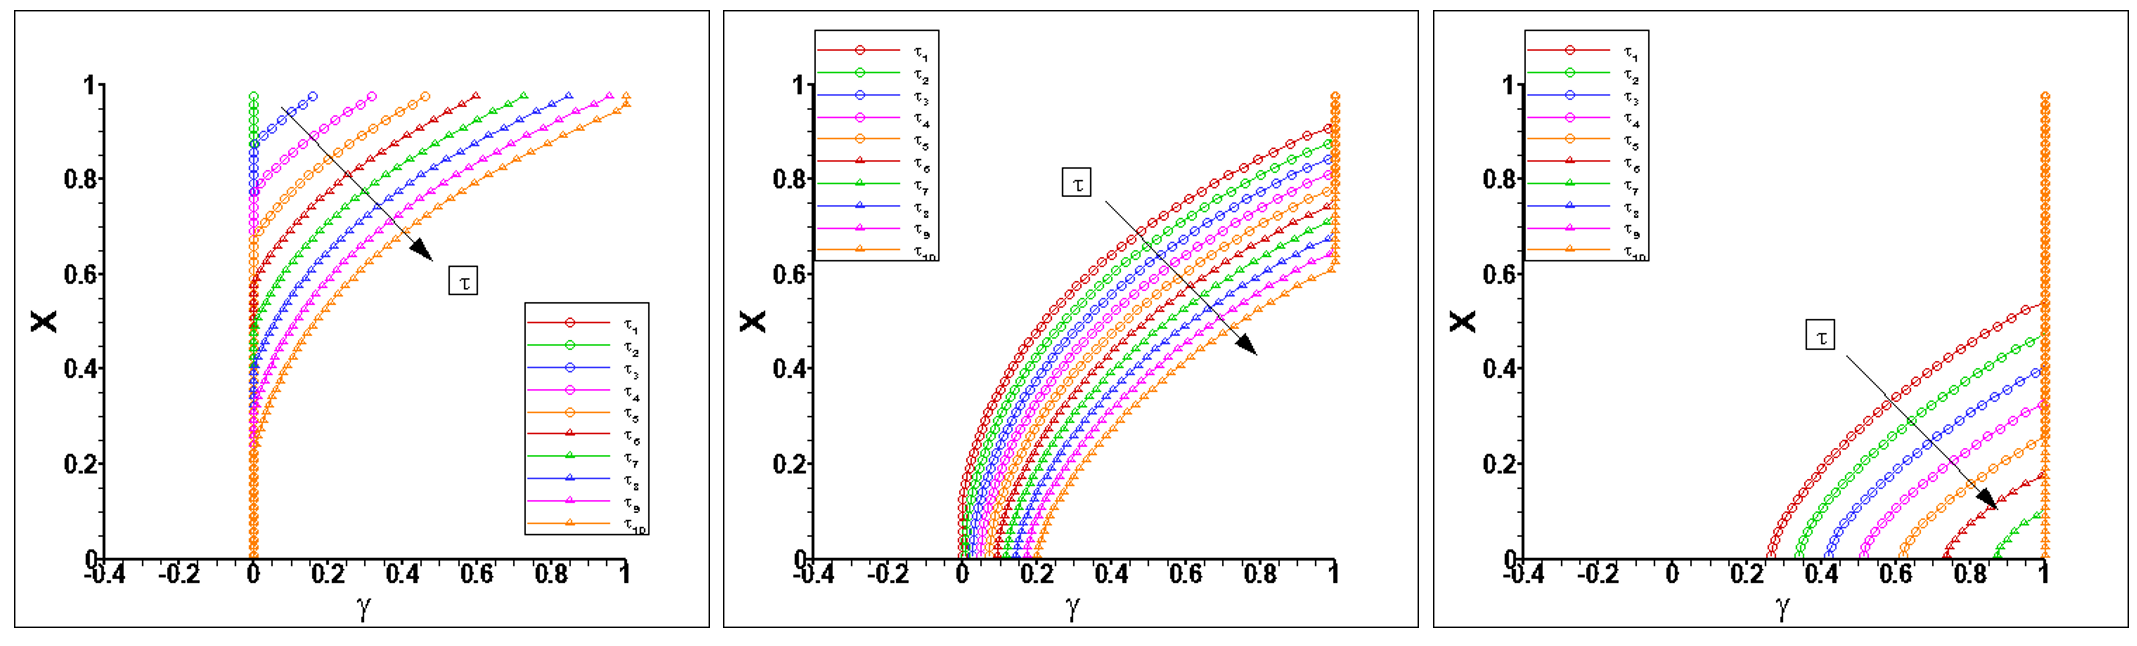
Figure 7. Axial Distribution of the melt fraction at different time instants (the exact same ones as in Figure 6).
In Figures 8–10, the evolution of the melting process is depicted also in terms of contour plots of temperature of both HTF and PCM (Figure 8 and Figure 9 respectively), as well as of the melt fraction (Figure 10) at selected time instants during the melting process. As can be seen, the temperature field is one-dimensional for the adiabatic boundary condition that has been imposed on the side wall. The temperature field in the HTF shows an almost linear stratification after one hour of charging, when the melting front is still located at about 2/3 of the height, but gradually more uniform temperature zones develop, as melting proceeds further downwards and the PCM remains around the melting temperature. Finally, the HTF temperature attains the uniform value of 137 °C after 8 hours of charging. The development of melting can be also realized in terms of melt fraction contours, in Figure 10.
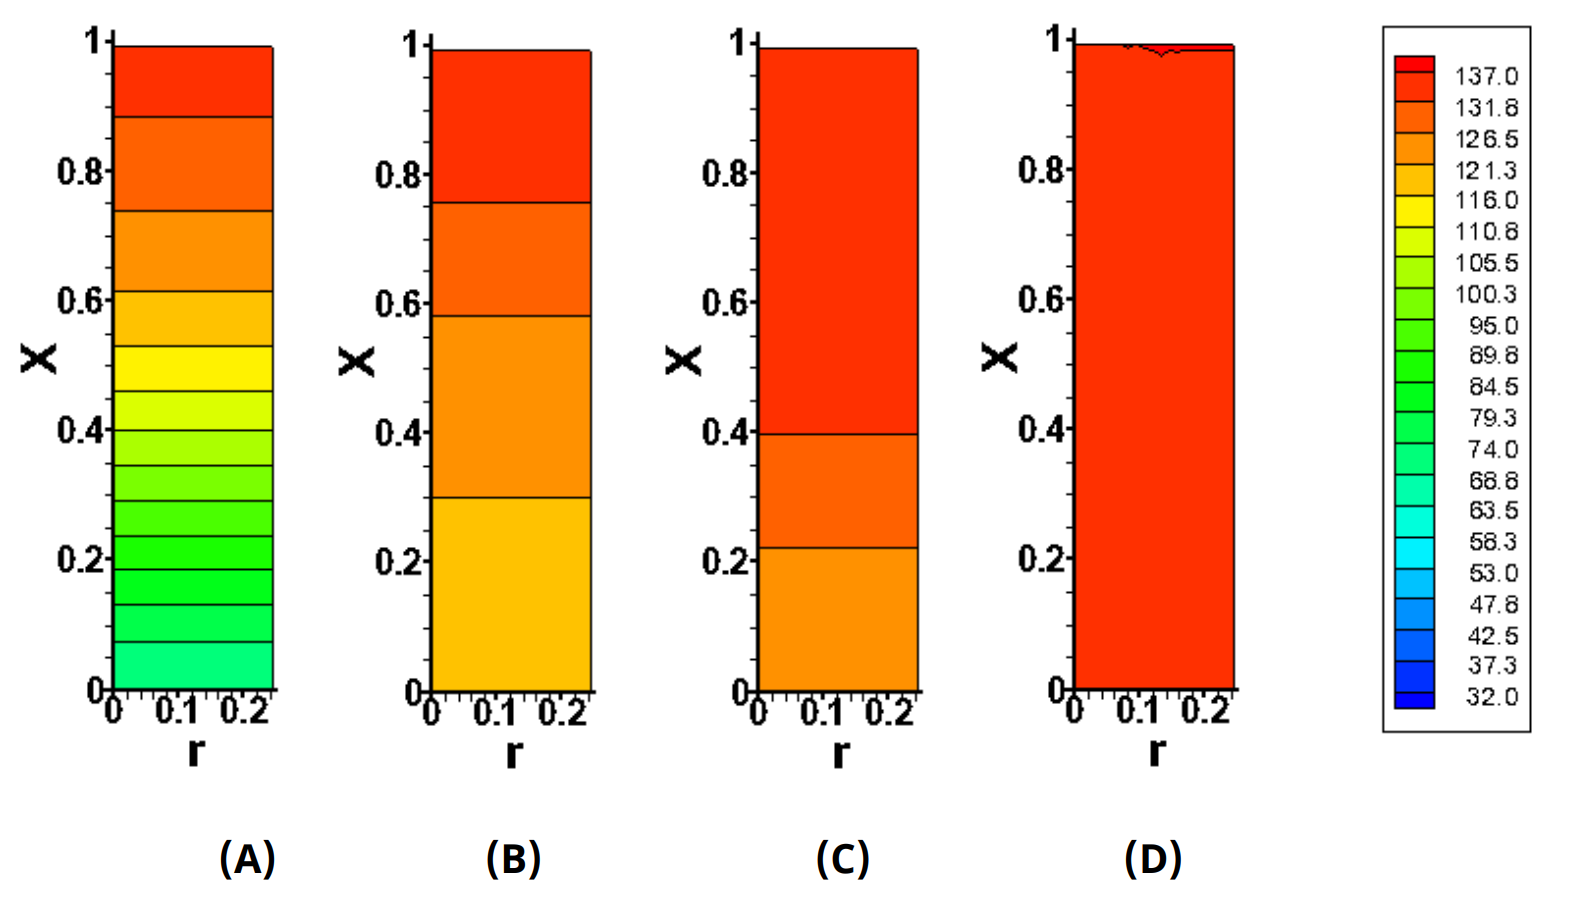
Figure 8. Development of the HTF temperature field in the packed bed during the melting process. Temperature contours at various time instants during charging (default case) at: (A) 1 hr, (B) 3 hrs., (C) 5.2 hrs and (D) 7.2 hrs.
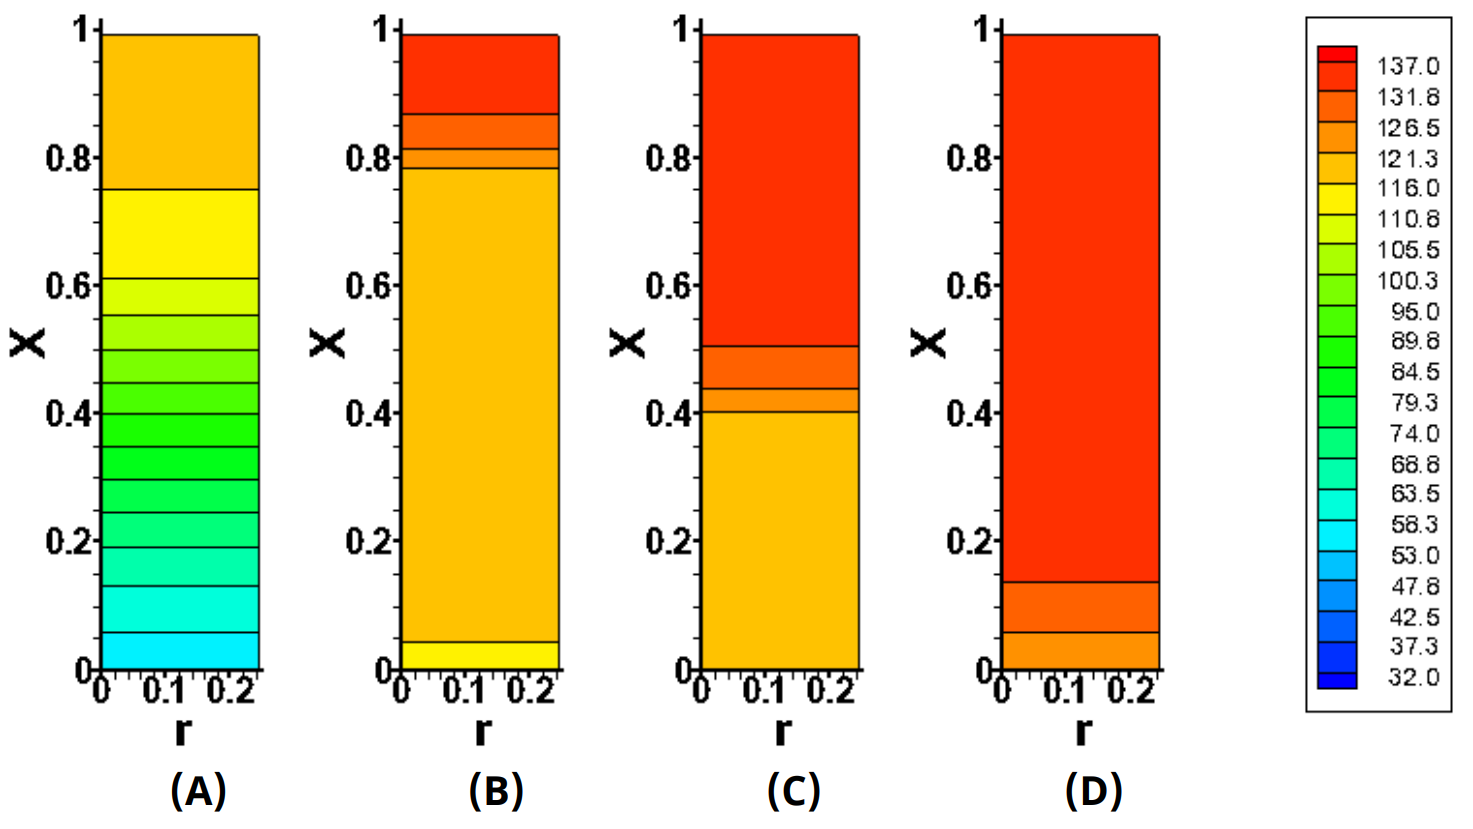
Figure 9. Development of the PCM temperature field in the packed bed during the melting process. Temperature contours at selected time instants during charging (default case) at: (A) 1 hr, (B) 3 hrs., (C) 5.2 hrs and (D) 7.2 hrs.
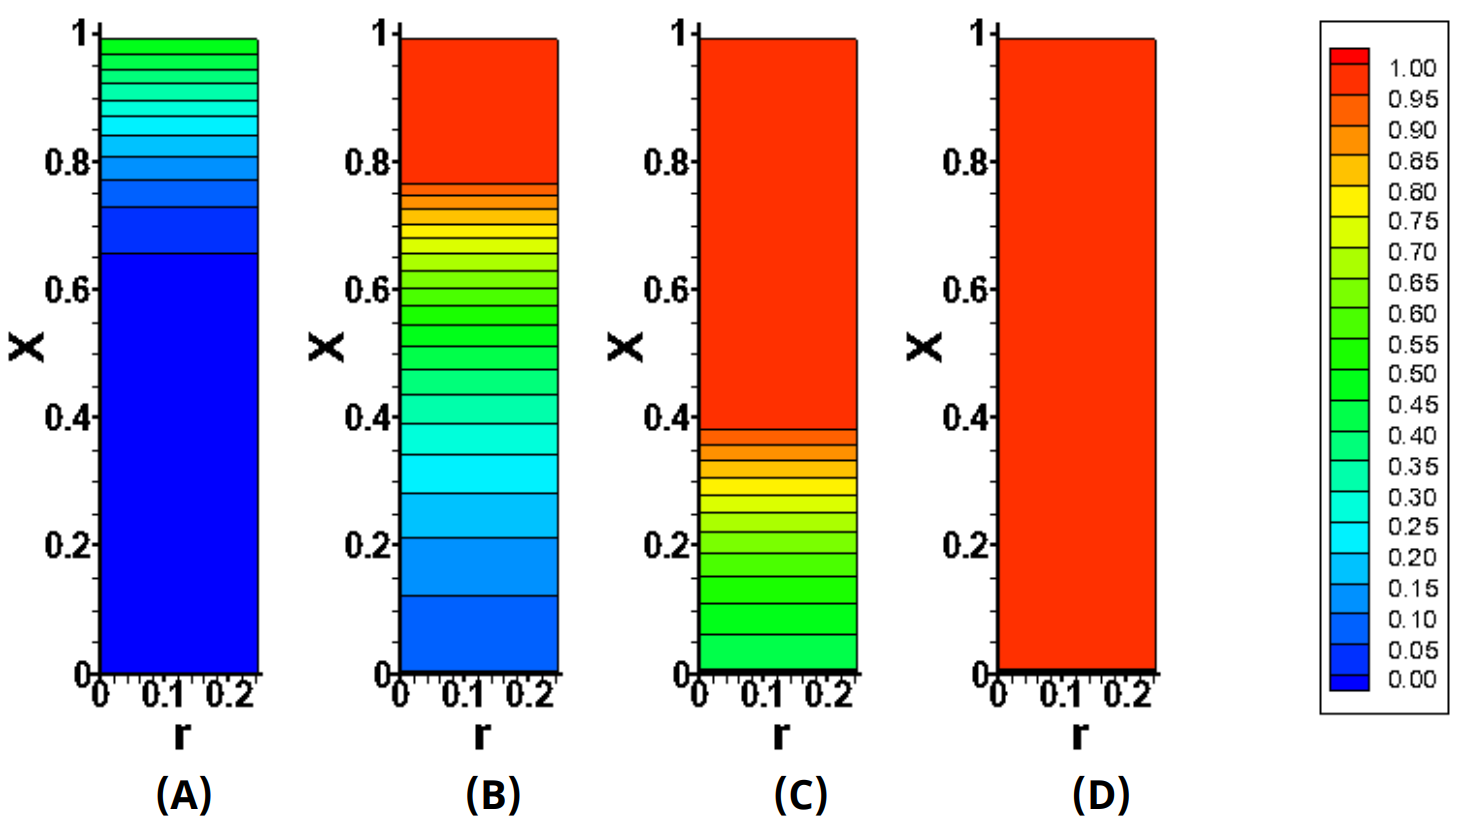
Figure 10. Melt fraction contours at selected time instants during charging (same as in Figure 9).
The evolution of the average melt fraction with time is also presented in Figure 11A, whereas the downward movement of the melting front is shown in Figure 11B, in terms of a dimensionless coordinate Xfr = x/H with respect to time.
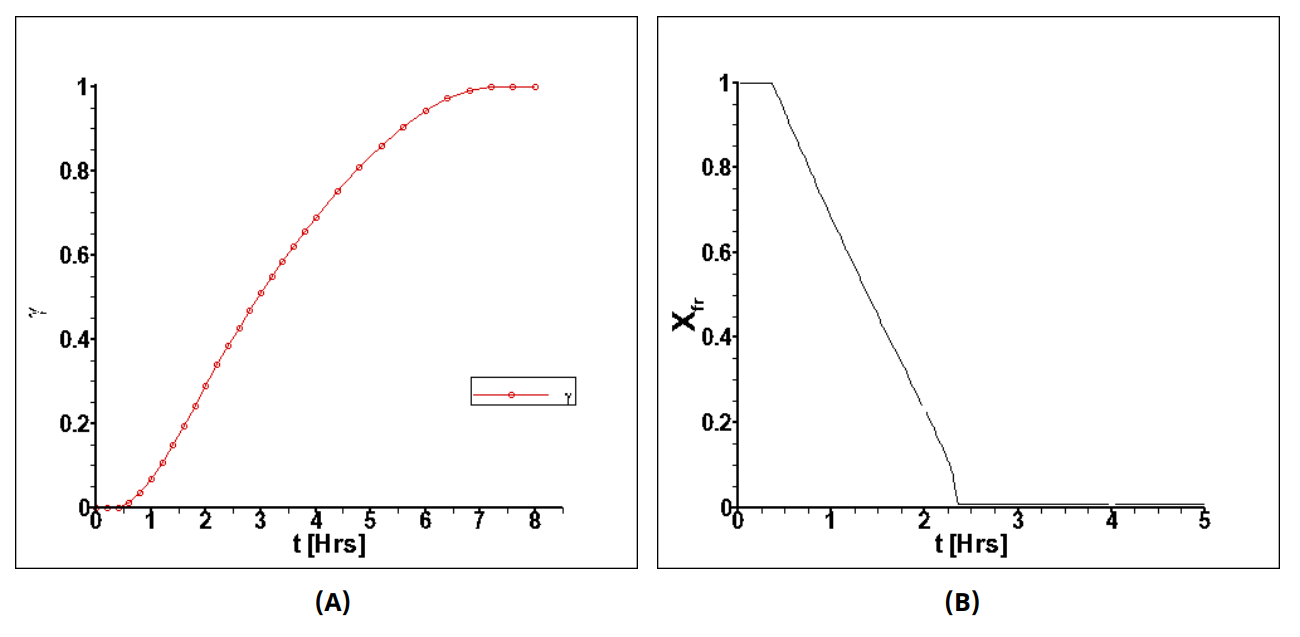
Figure 11. Evolution of the melting process for the default case. (A) Average Melt Fraction vs. Time and (B) Melting Front Location (Dimensionless) vs. time.
Figure 12 shows the total amount of heat stored during the period of 8 hours, in terms of total and latent heat. As may be seen, given that the charging starts at a relatively low temperature in this case (32 °C), way beyond the melting point of 117.7 °C, a large percentage of the energy stored is in terms of sensible heat (almost 76%), until the entire volume of PCM attains the melting temperature and latent heat starts being stored (almost 24% of total heat).
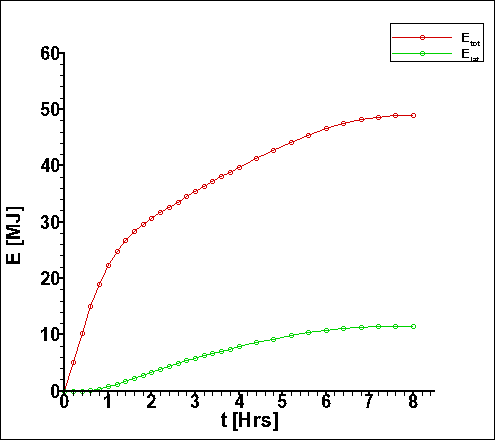
Figure 12. Total Energy and Latent Heat stored vs. time.
In order to study the effect of various thermal-hydraulic parameters on charging, the HTF flow rate was varied from the default value of 100 kg/h to two additional values, namely 80 kg/h and 120 kg/h. The particle Reynolds number are respectively calculated as: Rep = 4.46 and 6.69 and the respective interstitial velocity values are uint = 2.31 10-4 m/s and 3.46 a 10-4 m/s. The remaining parameters are kept fixed and the entire charging interval is still 8 hours.
Two more quantities that are defined here to be used as performance indicators are the charging efficiency ηch and the stratification number Str. The former is defined at each time instant as [29]:
where
The stratification number is defined as [29]:
where the numerator is the mean temperature gradient of the HTF at all radial positions at a given time instant, while the denominator is the maximum mean value of the same quantity over the entire time period.
In order to distinguish between the different cases to be compared under parametric variation, the labeling of the cases shown in Table 3 is used. The default case (C1) is the case used in the experimental measurements and for the remaining cases, either the flow rate is varied, keeping inlet and initial temperatures fixed (cases C2 and C3), or the inlet temperature is varied by keeping the flow rate and the initial temperature fixed (cases C4 and C5). For the variable inlet temperature cases (V1-V3), a range of values is selected for the inlet temperature, as will be further explained below.
Table 3. The different cases considered to study the effect of parameter variation.
The variation of the mean melt fraction with time is shown in Figure 13. As observed, for the value of 80 kg/h, the melting was not completed within the period of 8 hours. On the other hand, the results for 100 kg/h and 120 kg/h almost overlap, indicating that increasing the flow rate beyond the value of 100 kg/h has little effect on the melting process. However, in Figure 13B, it may be observed that the charging efficiency increases as the flow rate decreases. This is because, during charging over a wide temperature range (32° to 137 °C), a large portion of the transferred energy is stored in the form of sensible heat, and the delayed melting process does not affect the overall efficiency.
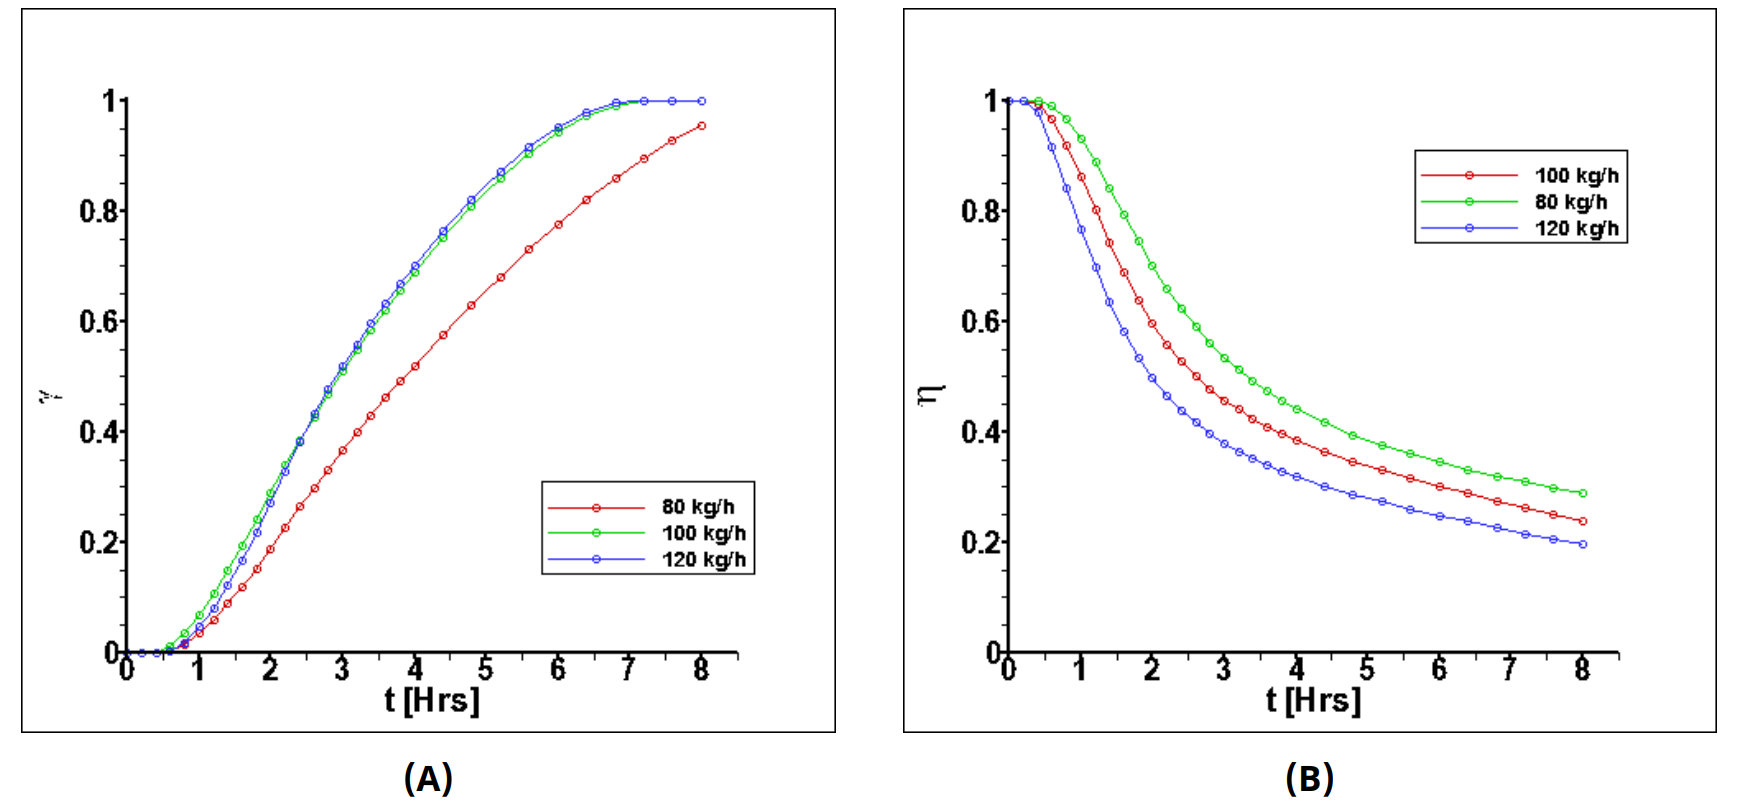
Figure 13. Effect of flow rate on melting process evolution. (A) melt fraction, (B) charging efficiency.
The effect of the HTF inlet temperature is investigated in two parts. First a constant value for the entire duration of charging is considered, i.e., heating from a constant temperature heat source. Temperature values of 130 °C and 150 °C are considered, one below and one above the default case of 137 °C. The initial temperature and the flow rate are kept the same as in the default case (Section 3.1). In this context, it is useful to introduce a parameter which has been used by several researchers in the past for melting problems [44], namely the degree of subcooling (or subcooling parameter) Sb, which is defined as:
where T0 is the initial, uniform temperature of both HTF and PCM in the tank. This parameter allows for a more systematic assessment of the effect of initial subcooling of the solid PCM, as this is clearly expected to affect the melting process, owing to the fact that part of the heat transferred to the solid-liquid interface diffuses into the solid core and only part of it is used to actually melt the PCM at any given time [44]. The respective values of this parameter are Sb = 0.816 for the default case (C1) and Sb = 0.874 and 0.726, for cases C4 and C5 of Table 3, respectively.
The computed results for the new values of the inlet temperature are shown in Figure 14, where it may be observed that for the lowest of the three temperatures, Tin =130 °C, the melting has not been completed after a period of 8 hours, whereas the process is completed sooner the higher the inlet temperature, as expected. Regarding the charging efficiency, while the melting process is still in progress, the efficiency is higher the higher the inlet temperature, but after 7 hours the efficiency for Tin =150 °C comes close to the values for the other two temperatures, as melting has completed and the transfer of heat is in the sensible mode. The study of Roy and Sengupta in spherical enclosures [44] found that the melting times are not significantly affected as long as Sb is less than 0.5, but start increasing sharply beyond this value, especially for Sb > 0.75.
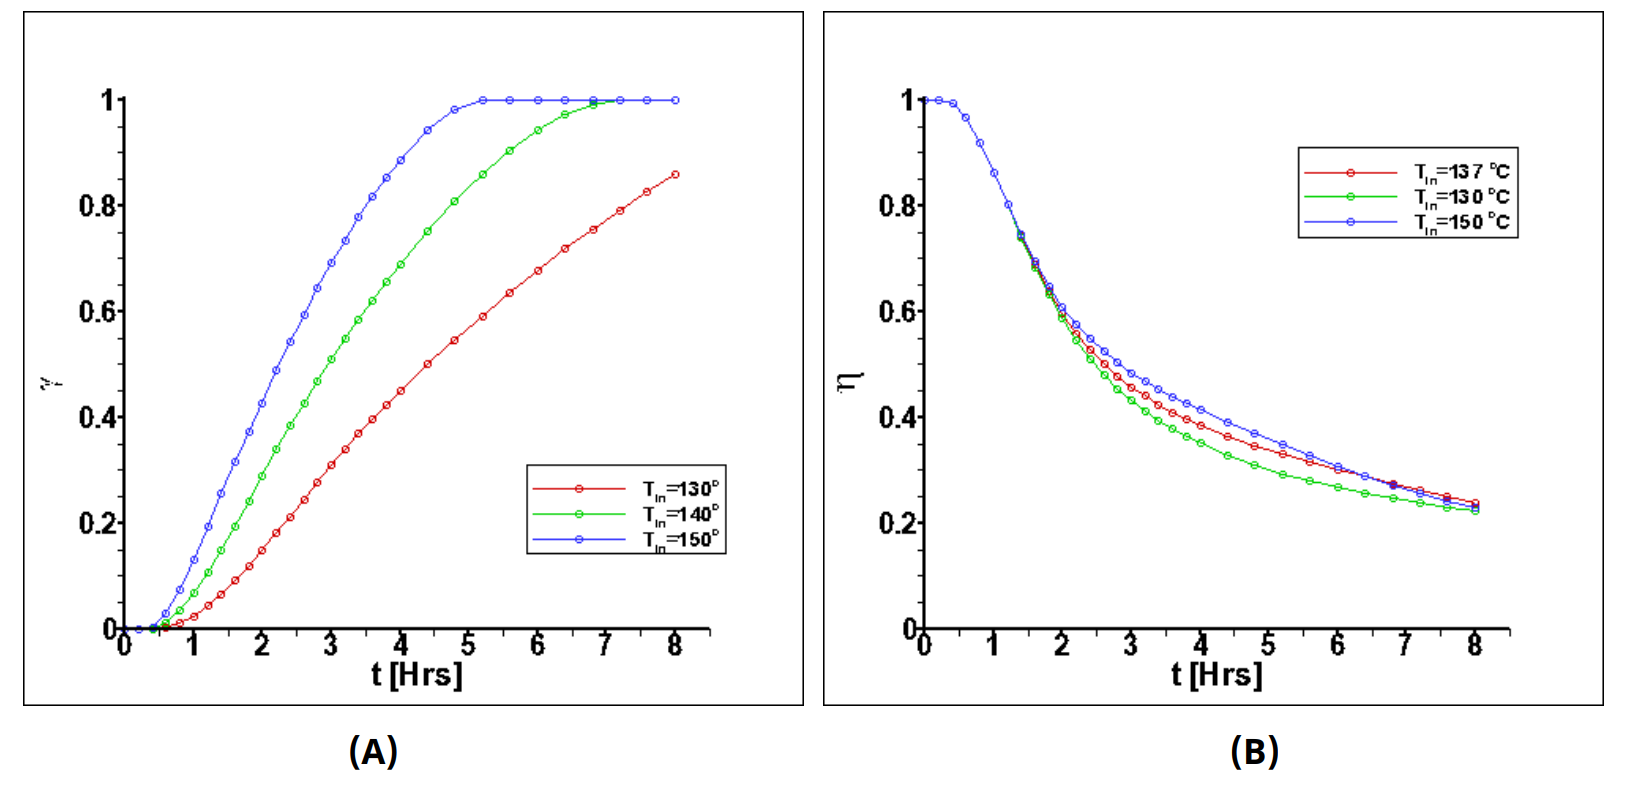
Figure 14. Effect of constant HTF inlet temperature on melting process. (A) melt fraction and (B) charging efficiency for flow rate:
Here a profile typical of a PTC collector is being used at inlet obtained, for instance, from curves typical of different types of thermal oils [45] and can be very well approximated by a second degree polynomial. The main assumption is that the tank would be part of solar system operating in a cyclic mode, between a lower and a higher temperature limit. Three ranges are considered in that regard, namely: V1, in the range Tin = 80°–140 °C, V2 in the range 100°–140 °C and V3, in the range 100°–150 °C (see Figure 15 and Table 3). The upper temperature limit is restricted by the decomposition temperature of erythritol, which is 160 °C [46], thus, a safe upper limit is taken as 150 °C, whereas the lower limit should be below the melting point of the PCM, i.e., below 118 °C. It should be noted that very few studies have considered the study of a packed bed in conjunction with a variable-temperature heat source, such as a solar collector [47]. The respective values of the subcooling parameter Sb of the previous paragraph and defined based on Tin,max, are 0.628, 0.442 and 0.354 for cases V1, V2 and V3 respectively.
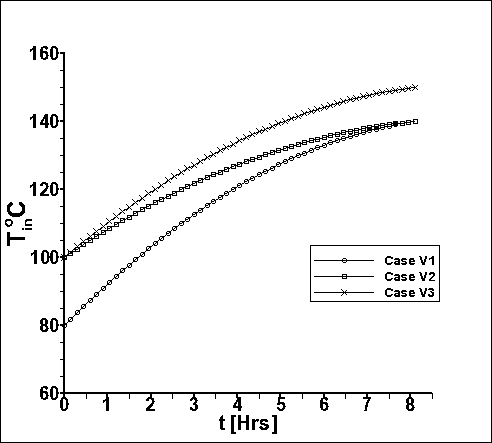
Figure 15. The three different forms considered for the variable HTF inlet temperature, approximating input from a solar parabolic-trough collector (see Table 3).
The results from the three cases for the present computations are shown in Figure 16, again in terms of the quantities used in the previous comparisons, i.e., melt fraction and charging efficiency and for a charging period of 8 hours. It may be observed that only for the last case (temperature range 100°–150 °C) does the melting process come closer to completion, with the mean melt fraction attaining a final value of 0,96. For the other two cases, the end values are below 0,8. With regard to charging efficiency, the comparison is shown in Figure 16B. What may be observed is that the three curves overlap while heating is still in the sensible mode, until about 3 hours, when the melting for all cases has commenced. After that time, the efficiency increases at a higher rate, the higher the inlet temperature, whereas for the lower temperature (80 °C), first a slight decrease may be observed.
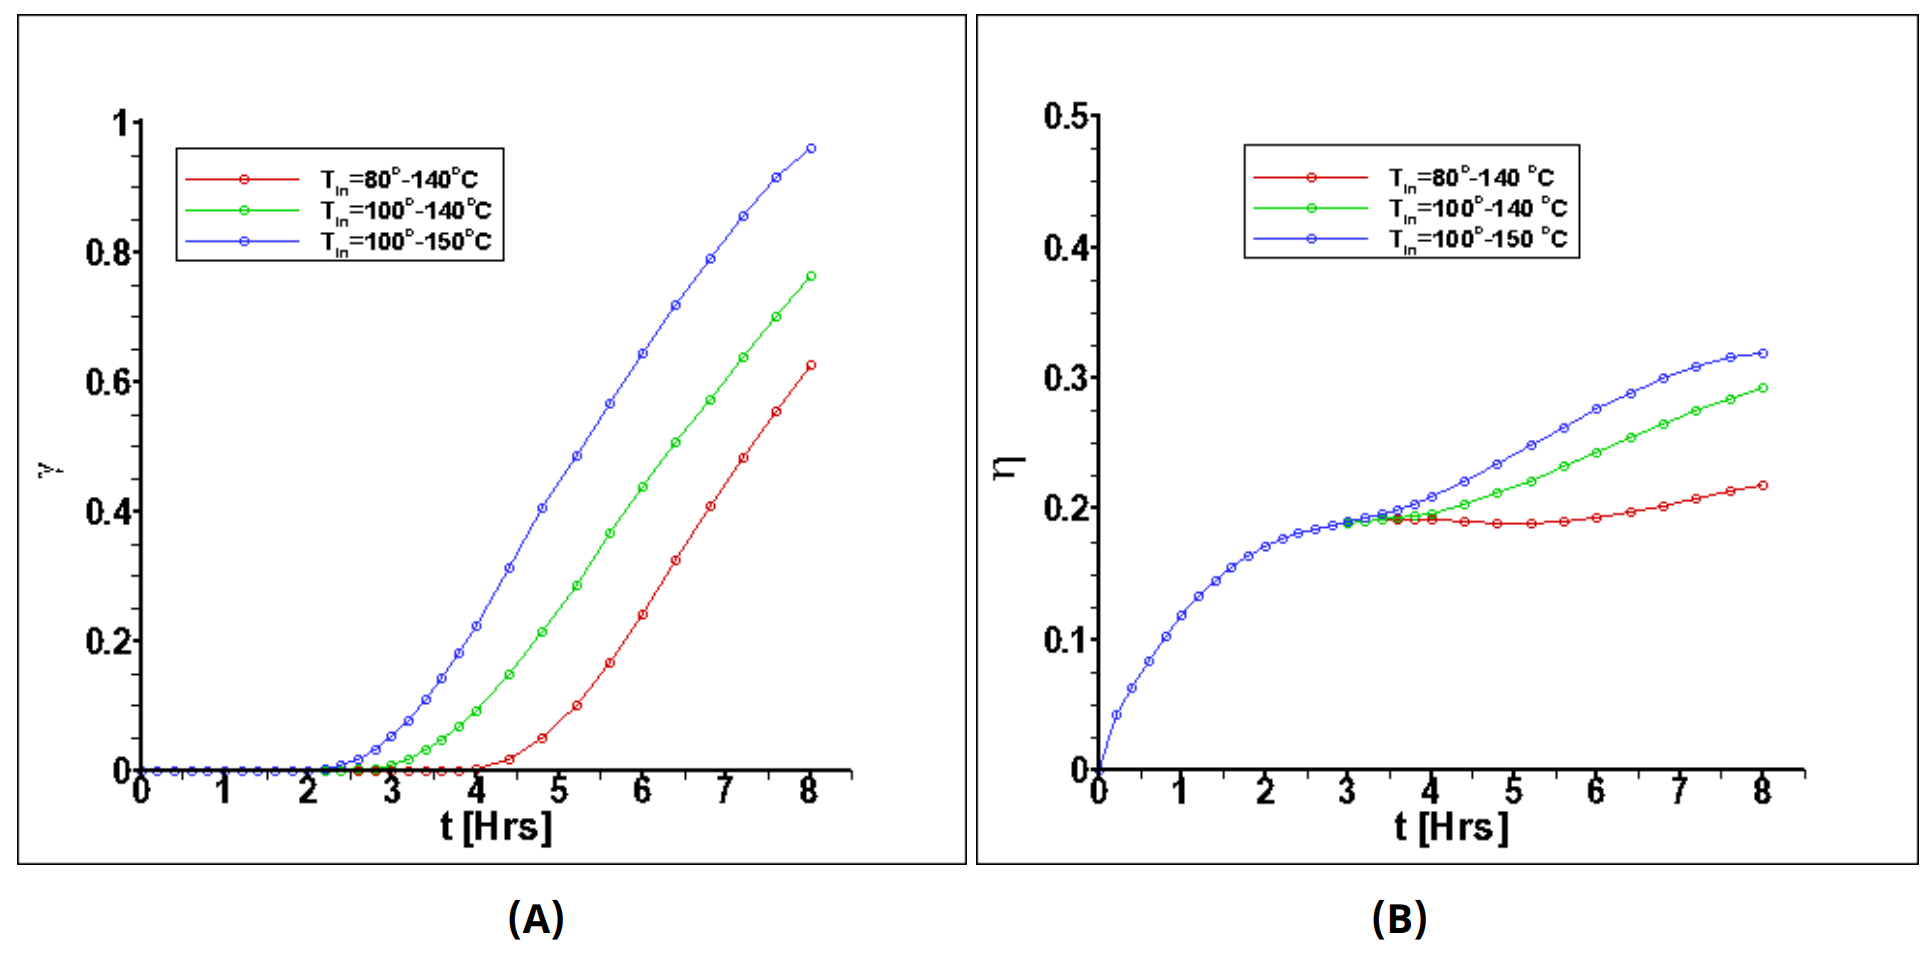
Figure 16. Effect of variable inlet temperature (solar PTC) on the melting process. (A) Melt fraction and (B) charging efficiency vs. time for three different temperature-range scenarios.
Regarding axial distributions of significant quantities in the tank, these are comparatively presented in Figure 17, for the three cases V1-V3 against the default case C1. It becomes obvious that for the constant-inlet-temperature case C1 the melting proceeds faster and has completed at 7.2 hours (right column), whereas from the variable-temperature cases, it has completed for nearly the top 2/3 of the tank height for case V3, for the top 1/3 for case V2 and for the top 1/4 for case V1.
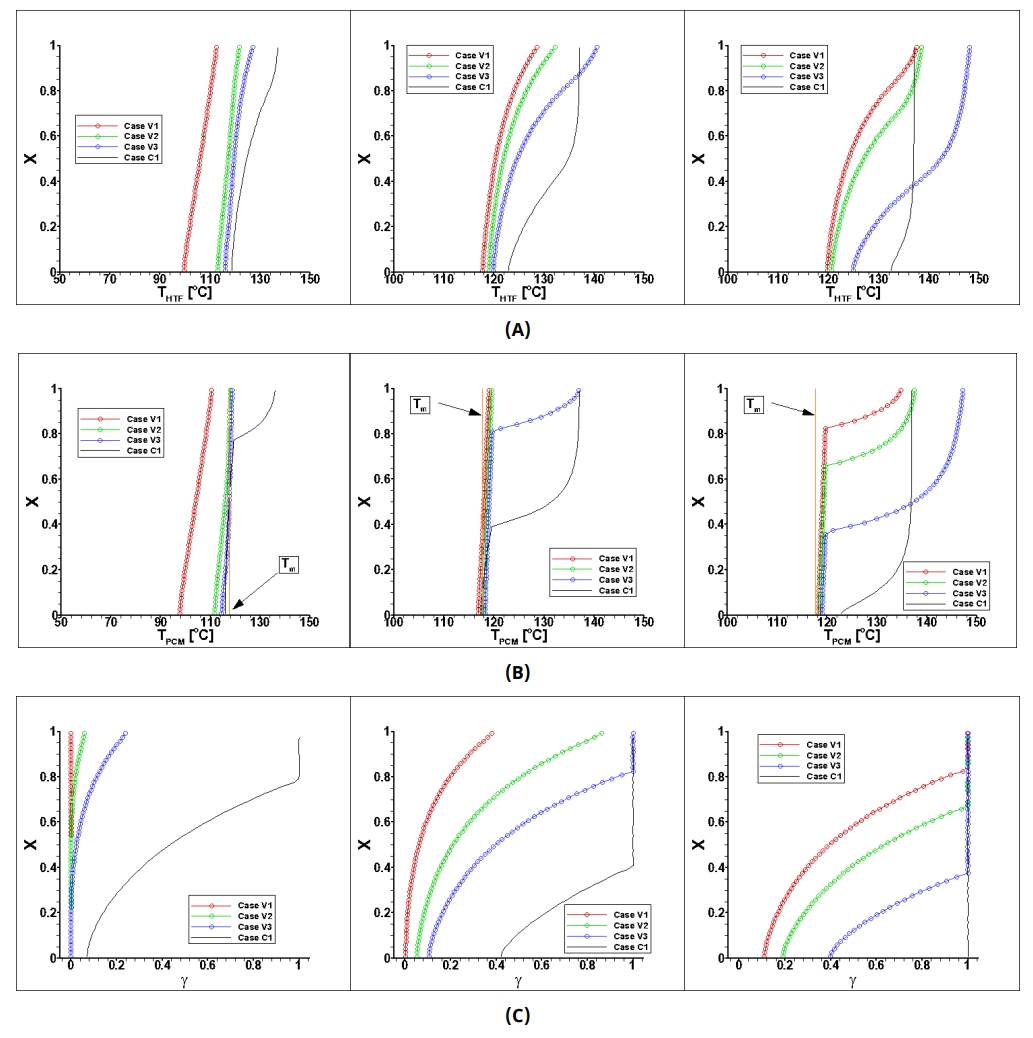
Figure 17. Comparison of results (axial distributions) obtained for the variable inlet-temperature cases, V1-V3, against the default case C1 at selected time instants: left column at 3 Hrs, middle column at 5.2 Hrs and right column at 7.2 hrs. (A) HTF Temperature; (B) PCM Temperature; (C) Melt fraction.
Another quantity of interest is the stratification number defined earlier [29], used also in [48], which shows how the evolution of the melting process relates to the temperature stratification of the HTF in the tank at all times. Its value varies in the range 0 to 1, with one corresponding to the maximum value during the charging period. The computed variation of Str with time is presented in Figure 18 for all cases considered here. It may at first be observed that for the constant inlet temperature cases the variation with time over the 8-hour interval shows a very similar pattern. Namely, it starts at its maximum value at t = 0, followed by a rapid drop at first, and before the phase-change process (melting) takes place. Then a plateau sets in during melting, followed by a gradual decrease to zero values, this representing a state where the temperature of the HTF in the tank is almost uniform (as seen, for instance, in Figure 8D).
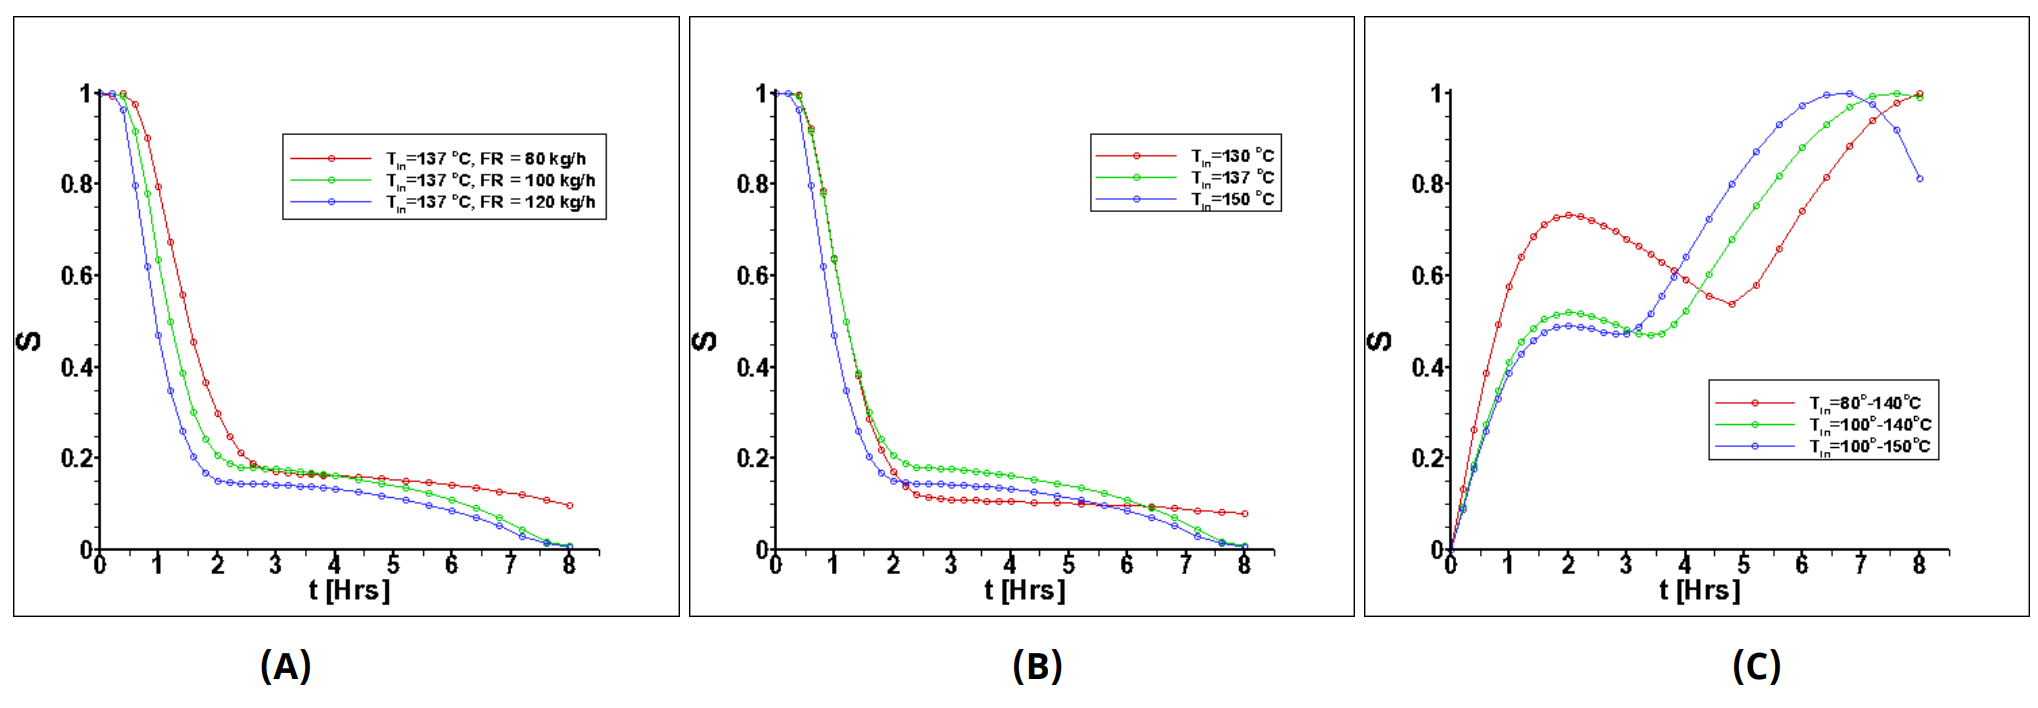
Figure 18. Stratification number for all cases considered. (A) Effect of flow rate (cases C1-C3), (B) effect of inlet (constant) temperature (cases C1 vs. C4-C5) and (C) effect of variable inlet temperature (cases V1-V3).
For the cases with time-varying inlet temperature (V1-V3), the stratification factor shown in Figure 18C exhibits some interesting trends. First of all, its value starts at Str = 0, since the inlet temperature is equal to the initial temperature in the tank at t = 0. During the first three hours, there is a local maximum of Str, more pronounced for case V1 with the lowest inlet temperature, as the HTF enters the tank at a steadily increasing temperature. This maximum corresponds to a period of sensible heating of the solid PCM, whereby, since melting is delayed in this case compared to cases V2 and V3, and an almost linear temperature gradient is allowed enough time to develop in the tank. On the other hand, for cases V2 and V3, melting of the PCM starts earlier and this maintains its temperature within a narrow range about the melting point, which affects the development of the HTF temperature distribution by making it more uniform across the bed height.
Subsequently, and after a local minimum, the values of Str start rising again, at an almost constant rate for all cases during the phase-change period as, starting from the top, for each layer of the PCM melting is sequentially completed and sensible heating of the liquid material now takes place, leading to a new stratification. The maximum value Str = 1 is attained near the end of melting, which has not been completed for cases V1 and V2, as discussed before. For case V3, melting has almost completed and with nearly all PCM layers now being sensibly heated, the tank tends to a more uniform temperature distribution again.
More details on the development of the melting process are obtained with the data shown in Table 4. The symbol tm,s denotes the starting time for melting and tm,e the respective end time. The former is shown both at the top (HTF inlet) and the bottom (outlet) of the tank (2nd and 3rd column respectively), whereas the latter at the bottom (outlet) (4th column). The duration of melting (5th column) is the difference between 2nd and 4th column and whenever a time of 480 min (8 hours) appears in the 4th column it means that melting has not yet completed. This information may also directly be inferred from the last column (γend), which shows the value of the average melt fraction of the PCM in the tank at the end of the 8-hour period.
Table 4. Characteristic times of the melting process for all cases considered.
A latent-heat storage tank based on encapsulated erythritol as the phase-change material has been investigated in the process of charging, where melting of the PCM takes place. Preliminary measurements are carried out in an experimental setup heated by an electric source, at operating parameters representative of a medium-temperature concentrating solar system. A numerical model for the packed bed configuration representing the storage tank containing 200 spherical capsules of a shell made of steel and filled with erythritol has been developed. The model was shown to predict the behavior of the tank with considerable accuracy, allowing for further evaluating the tank behavior over a range of thermal-hydraulic parameters, beyond those used in the charging experiments. It also provides insight regarding the evolution of the phase-change process itself and the effect of operating parameters, which would have been difficult to obtain experimentally in the present packed-bed system.
It was found that the flow rate of the HTF can improve the efficiency of charging up to a certain value (100 kg/h), beyond which it has no influence. The HTF inlet and the initial tank temperatures (solid subcooling) play a significant role in the melting process during charging. It was found that for achieving full melting of the PCM within a period of 8 hours (a typical daily solar cycle) it is necessary to supply the HTF at a temperature as high as 150 °C, which is more than 30 degrees above the melting point of erythritol. Also, an initial solid PCM subcooling of more than 20 degrees will not allow full melting of the material within a daily cycle. The analysis of the results will be valuable in the design of a storage system for medium-temperature concentrating collectors using the present latent-heat, packed-bed configuration.
Not applicable.
Dataset available on request from the authors.
We acknowledge support of this work by the project “PROMETHEUS: A Research Infrastructure for the Integrated Energy Chain” (MIS 5002704) which is implemented under the Action “Reinforcement of the Research and Innovation Infrastructure”, funded by the Operational Programme “Competitiveness, Entrepreneurship and Innovation” (NSRF 2014–2020) and co-financed by Greece and the European Union (European Regional Development Fund).
The authors have declared that no competing interests exist.
Conceptualization: E.P., N.P. & V.B.; Methodology: E.P., N.P. & V.B.; Software: E.P. & N.P.; Validation: E.P. & N.P.; Formal analysis: E.P. & N.P.; Investigation: E.P., N.P. & V.B.; Resources: E.P., N.P. & V.B.; Data Curation: E.P. & N.P.; Writing - Original Draft: E.P. & N.P.; Writing - Review & Editing: E.P. & N.P.; Visualization: E.P. & N.P.; Supervision: E.P. & V.B.; Project administration: E.P. & V.B.; Funding acquisition: E.P. & V.B.
| 1. | Ray AK, Rakshit D, Ravikumar K. High-temperature latent thermal storage system for solar power: Materials, concepts, and challenges. Clean Eng Technol. 2021;4:100155. [Google Scholar] [CrossRef] |
| 2. | Matuszek K, Kar M, Pringle JM, Macfarlane DR. Phase Change Materials for Renewable Energy Storage at Intermediate Temperatures. Chem Rev. 2023;123(1):491-514. [Google Scholar] [CrossRef] |
| 3. | Crespo A, Barreneche C, Ibarra M, Platzer W. Latent thermal energy storage for solar process heat applications at medium high temperatures - A review. Sol Energy. 2019;192:3-34. [Google Scholar] [CrossRef] |
| 4. | Martínez FR, Borri E, Mani Kala S, Ushak S, Cabeza LF. Phase change materials for thermal energy storage in industrial applications. Heliyon. 2025;11(1):e41025. [Google Scholar] [CrossRef] |
| 5. | Daniarta S, Nemś M, Kolasiński P. A review on thermal energy storage applicable for low- and medium-temperature organic Rankine cycle. Energy. 2023;278:127931. [Google Scholar] [CrossRef] |
| 6. | Pagkalos C, Dogkas G, Koukou MK, Konstantaras J, Lymperis K, Vrachopoulos MG. Evaluation of water and paraffin PCM as storage media for use in thermal energy storage applications: A numerical approach. Int J Thermofluids. 2020;1:100006. [Google Scholar] [CrossRef] |
| 7. | Dogkas G, Konstantaras J, Koukou MK, Vrachopoulos MG, Pagkalos C, Stathopoulos VN, et al. Development and experimental testing of a compact thermal energy storage tank using paraffin targeting domestic hot water production needs. Therm Sci Eng Prog. 2020;19:100573. [Google Scholar] [CrossRef] |
| 8. | Shao X, Yang S, Fan L, Yuan Y. Sugar alcohol phase change materials for low-to-medium temperature thermal energy storage: A comprehensive review. J Energy Storage. 2023;68:107848. [Google Scholar] [CrossRef] |
| 9. | Gunasekara SN, Pan R, Chiu JN, Martin V. Polyols as phase change materials for surplus thermal energy storage. Appl Energy. 2016;162:1439-1452. [Google Scholar] [CrossRef] |
| 10. | Del Barrio EP, Godin A, Duquesne M, Daranlot J, Jolly J, Alshaer W, et al. Characterization of different sugar alcohols as phase change materials for thermal energy storage applications. Sol Energy Mater Sol Cells. 2017;159:560-569. [Google Scholar] [CrossRef] |
| 11. | Tomassetti S, Aquilanti A, Muciaccia PF, Coccia G, Mankel C, Koenders EAB, et al. A review on thermophysical properties and thermal stability of sugar alcohols as phase change materials. J Energy Storage. 2022;55:105456. [Google Scholar] [CrossRef] |
| 12. | Liu C, Cheng Q, Li B, Liu X, Rao Z. Recent advances of sugar alcohols phase change materials for thermal energy storage. Renew Sustain Energy Rev. 2023;188:113805. [Google Scholar] [CrossRef] |
| 13. | Liu H, Jing J, Liu J, Wang X. Sugar alcohol-based phase change materials for thermal energy storage: Optimization design and applications. Renew Sustain Energy Rev. 2024;199:114528. [Google Scholar] [CrossRef] |
| 14. | Yang S, Shi HY, Liu J, Lai YY, Bayer Ö, Fan LW. Supercooled erythritol for high-performance seasonal thermal energy storage. Nat Commun. 2024;15(1):4948. [Google Scholar] [CrossRef] |
| 15. | Mayilvelnathan V, Valan Arasu A. Experimental investigation on thermal behavior of graphene dispersed erythritol PCM in a shell and helical tube latent energy storage system. Int J Therm Sci. 2020;155:106446. [Google Scholar] [CrossRef] |
| 16. | Agyenim F, Eames P, Smyth M. A comparison of heat transfer enhancement in a medium temperature thermal energy storage heat exchanger using fins. Sol Energy. 2009;83(9):1509-1520. [Google Scholar] [CrossRef] |
| 17. | Agyenim F, Eames P, Smyth M. Heat transfer enhancement in medium temperature thermal energy storage system using a multitube heat transfer array. Renew Energy. 2010;35(1):198-207. [Google Scholar] [CrossRef] |
| 18. | Wang W, He S, Guo S, Yan J, Ding J. A combined experimental and simulation study on charging process of Erythritol-HTO direct-blending based energy storage system. Energy Convers Manag. 2014;83:306-313. [Google Scholar] [CrossRef] |
| 19. | Wang W, Li H, Guo S, He S, Ding J, Yan J, et al. Numerical simulation study on discharging process of the direct-contact phase change energy storage system. Appl Energy. 2015;150:61-68. [Google Scholar] [CrossRef] |
| 20. | Anish R, Mariappan V, Suresh S. Experimental investigation on melting and solidification behaviour of erythritol in a vertical double spiral coil thermal energy storage system. Sustain Cities Soc. 2019;44:253-264. [Google Scholar] [CrossRef] |
| 21. | Anish R, Joybari MM, Seddegh S, Mariappan V, Haghighat F, Yuan Y. Sensitivity analysis of design parameters for erythritol melting in a horizontal shell and multi-finned tube system: Numerical investigation. Renew Energy. 2021;163:423-436. [Google Scholar] [CrossRef] |
| 22. | Papadimitratos A, Sobhansarbandi S, Pozdin V, Zakhidov A, Hassanipour F. Evacuated tube solar collectors integrated with phase change materials. Sol Energy. 2016;129:10-19. [Google Scholar] [CrossRef] |
| 23. | Pawar VR, Sobhansarbandi S. Design optimization and heat transfer enhancement of energy storage based solar thermal collector. Sustain Energy Technol Assess. 2021;46:101260. [Google Scholar] [CrossRef] |
| 24. | Coccia G, Aquilanti A, Tomassetti S, Comodi G, Di Nicola G. Design, realization, and tests of a portable solar box cooker coupled with an erythritol-based PCM thermal energy storage. Sol Energy. 2020;201:530-540. [Google Scholar] [CrossRef] |
| 25. | Stekli J, Irwin L, Pitchumani R. Technical challenges and opportunities for concentrating solar power with thermal energy storage. J Therm Sci Eng Appl. 2013;5(2):021011. [Google Scholar] [CrossRef] |
| 26. | Karthikeyan S, Velraj R, Senthil R. Overview of numerical, experimental and parametric studies on the spherical container-based packed bed latent heat storage. J Energy Storage. 2024;102:114089. [Google Scholar] [CrossRef] |
| 27. | Kuravi S, Trahan J, Goswami DY, Rahman MM, Stefanakos EK. Thermal energy storage technologies and systems for concentrating solar power plants. Prog Energy Combust Sci. 2013;39(4):285-319. [Google Scholar] [CrossRef] |
| 28. | Lou W, Luo L, Hua Y, Fan Y, Du Z. A review on the performance indicators and influencing factors for the thermocline thermal energy storage systems. Energies. 2021;14(24):8384. [Google Scholar] [CrossRef] |
| 29. | He X, Qiu J, Wang W, Hou Y, Ayyub M, Shuai Y. A review on numerical simulation, optimization design and applications of packed-bed latent thermal energy storage system with spherical capsules. J Energy Storage. 2022;51:104555. [Google Scholar] [CrossRef] |
| 30. | Beemkumar N, Karthikeyan A, Parthasarathy C, Bradley Bright B. Heat transfer analysis of latent heat storage system using D-sorbitol as PCM. ARPN J Eng Appl Sci. 2015;10(11):5017-5021. [Google Scholar] |
| 31. | Beemkumar N, Karthikeyan A, Ramachandran S. Heat transfer enhancement of the latent heat storage system using different encapsulating materials with and without fins. Int J Ambient Energy. 2017;38(1):77-84. [Google Scholar] [CrossRef] |
| 32. | Beemkumar N, Karthikeyan A, Saravanakumar B, Jayaprabakar J. Performance improvement of D-sorbitol PCM-based energy storage system with different fins. Int J Ambient Energy. 2018;39(4):372-376. [Google Scholar] [CrossRef] |
| 33. | Shobo AB, Mawire A. Experimental comparison of the thermal performances of acetanilide, meso-erythritol and an In-Sn alloy in similar spherical capsules. Appl Therm Eng. 2017;124:871-882. [Google Scholar] [CrossRef] |
| 34. | Mawire A, Lentswe KA, Shobo A. Performance comparison of four spherically encapsulated phase change materials for medium temperature domestic applications. J Energy Storage. 2019;23:469-479. [Google Scholar] [CrossRef] |
| 35. | Mawire A, Lefenya TM, Ekwomadu CS, Lentswe KA, Shobo AB. Performance comparison of medium temperature domestic packed bed latent heat storage systems. Renew Energy. 2020;146:1897-1906. [Google Scholar] [CrossRef] |
| 36. | Nazzi Ehms JH, De Césaro Oliveski R, Oliveira Rocha LA, Biserni C. Theoretical and numerical analysis on phase change materials (PCM): A case study of the solidification process of erythritol in spheres. Int J Heat Mass Transf. 2018;119:523-532. [Google Scholar] [CrossRef] |
| 37. | Junior JFR, Oliveski RDC, Rocha LAO, Biserni C. Numerical investigation on phase change materials (PCM): The melting process of erythritol in spheres under different thermal conditions. Int J Mech Sci. 2018;148:20-30. [Google Scholar] [CrossRef] |
| 38. | Yang S, Shao XF, Luo JH, Oskouei SB, Bayer Ö, Fan LW. A novel cascade latent heat thermal energy storage system consisting of erythritol and paraffin wax for deep recovery of medium-temperature industrial waste heat. Energy. 2023;265:126359. [Google Scholar] [CrossRef] |
| 39. | Ismail KAR, Stuginsky R Jr. Parametric study on possible fixed bed models for pcm and sensible heat storage. Appl Therm Eng. 1999;19(7):757-788. [Google Scholar] [CrossRef] |
| 40. | Esence T, Bruch A, Molina S, Stutz B, Fourmigué JF. A review on experience feedback and numerical modeling of packed-bed thermal energy storage systems. Sol Energy. 2017;153:628-654. [Google Scholar] [CrossRef] |
| 41. | Sebbar EH, Lamrani B, El Rhafiki T, Achemlal D, Oihi Y, Kousksou T. Latent heat storage system integrating phase change material in spherical capsules: A comparative study between three dynamic physical models. J Energy Storage. 2022;56:106007. [Google Scholar] [CrossRef] |
| 42. | Guo W, He Z, Meng Z, Zhang P. A comprehensive investigation of the mathematical models for a packed bed latent heat thermal energy storage system. Int J Energy Res. 2021;45(10):15005-15021. [Google Scholar] [CrossRef] |
| 43. | Papanicolaou E, Jaluria Y. Mixed convection from an isolated heat source in a rectangular enclosure. Numer Heat Transf A Appl. 1991;18(4):427-461. [Google Scholar] [CrossRef] |
| 44. | Roy SK, Sengupta S. Melting of a Free Solid in a Spherical Enclosure: Effects of Subcooling. J Sol Energy Eng. 1989;111(1):32-36. [Google Scholar] [CrossRef] |
| 45. | Ouagued M, Khellaf A, Loukarfi L. Estimation of the temperature, heat gain and heat loss by solar parabolic trough collector under Algerian climate using different thermal oils. Energy Convers Manag. 2013;75:191-201. [Google Scholar] [CrossRef] |
| 46. | Kaizawa A, Kamano H, Kawai A, Jozuka T, Senda T, Maruoka N, et al. Thermophysical and heat transfer properties of phase change material candidate for waste heat transportation system. Heat Mass Transf. 2008;44(7):763-769. [Google Scholar] [CrossRef] |
| 47. | Wang W, Shuai Y, Qiu J, He X, Hou Y. Effect of steady-state and unstable-state inlet boundary on the thermal performance of packed-bed latent heat storage system integrated with concentrating solar collectors. Renew Energy. 2022;183:251-266. [Google Scholar] [CrossRef] |
| 48. | Stathopoulos N, Papadimitriou N, Belessiotis V, Papanicolaou E. Packed Bed Thermocline Thermal Energy Storage for Medium-Temperature Concentrating Solar Systems: Numerical and Experimental Study. J Power Energy Eng. 2023;11(5):1-23. [Google Scholar] [CrossRef] |

![]()
Copyright © 2026 Pivot Science Publications Corp. - unless otherwise stated | Terms and Conditions | Privacy Policy


