
Green Energy and Sustainability ISSN 2771-1641
Green Energy and Sustainability 2025;5(4):0009 | https://doi.org/10.47248/ges2505040009
Original Research Open Access
Optimizing the performance of a novel compact integrated thermal storage system (MiniStor) under diverse climate conditions
Alexandros Tsimpoukis
1

 ,
Georgios Martinopoulos
1,2
,
Nikolaos Nikolopoulos
1
,
Georgios Martinopoulos
1,2
,
Nikolaos Nikolopoulos
1
Correspondence: Nikolaos Nikolopoulos
Academic Editor(s): Tony Roskilly
Received: Jul 3, 2025 | Accepted: Oct 3, 2025 | Published: Oct 13, 2025
This article belongs to the Special Issue Selected Papers from the Conference ICRES 2025
© 2025 by the author(s). This is an Open Access article distributed under the terms of the Creative Commons License Attribution 4.0 International (CC BY 4.0), which permits unrestricted use, distribution, and reproduction in any medium or format, provided the original work is correctly credited.
Cite this article: Tsimpoukis A, Martinopoulos G, Nikolopoulos N. Optimizing the performance of a novel compact integrated thermal storage system (MiniStor) under diverse climate conditions. Green Energy Sustain. 2025;5(4):0009. https://doi.org/10.47248/ges2505040009
The widespread adoption of renewable energy technologies requires adaptable and replicable energy storage solutions tailored to diverse climatic conditions. This paper presents a comprehensive study on the replication potential of a compact hybrid energy storage solution, called MiniStor across various European sites. The MiniStor system integrates solar photovoltaic-thermal (PVT) and solar thermal collectors, a thermochemical (TCM) reactor using an ammonia cycle, a heat pump with phase change material (PCM) storage, and a battery for electrical energy management in buildings. Its core innovation, the TCM reactor stores heat through reversible ammonia-calcium chloride reactions, providing heating during winter and cooling during summer. To assess its broader applicability, the system’s replication potential was evaluated across various European climates and residential typologies, focusing on single-family homes. Simulation, based on specific meteorological and building data, demonstrated that MiniStor can effectively operate across diverse regions demonstrating significant potential for RES integration across Europe, with renewable energy coverage ranging from 32% to over 88% depending on location for the worst-case scenario. This work contributes to accelerating the large-scale integration of renewable energy storage solutions in the built environment across Europe.
KeywordsThermal storage, solar energy, PCM, TCM, thermochemical cycle, Solar heating & cooling
Decarbonizing Europe’s buildings is critical, as heating and cooling account for roughly half of the EU’s energy use [1]. Yet the building sector remains heavily dependent on fossil fuels. For example, renewables supplied only about 26% of the EU’s heating and cooling energy in 2023 [1], and the overall renewable share of final energy was around 24.5% that year [2]. These figures fall far short of the EU’s 2030 targets (now at 42.5% of energy from renewables [2]). In fact, recent analysis highlights that from 2015–2022 the share of renewables in building energy use increased by merely 6.3% (vs. an 18% target) and concludes that renewables for heating/cooling “need to quadruple” to stay on track [3]. Taken together, such statistics underscore the urgency of deploying renewable heating solutions (solar thermal and photovoltaic-thermal (PVT) collectors being the most mature technologies) and improving efficiency to tackle building energy demand and emissions.
Solar energy is a key renewable for buildings, since it is abundant and increasingly cost-effective [4]. However, solar output is inherently intermittent, and the wide application of solar based systems relies on long-term seasonal thermal storage to store excess energy and use it when needed [5]. Without storage, much of the solar gain is wasted or mismatched to demand. Therefore, effective thermal energy storage (TES) is essential to match solar supply with building heat demand and to stabilize the energy system [6]. TES systems are categorized in [6,7]:
Sensible heat storage (SHS): storing thermal energy by raising the temperature of a material (e.g. water or rocks);
Latent heat storage (LHS): using phase-change materials (PCMs) to store/release heat at nearly constant temperature;
Thermochemical storage (TCM): storing energy via reversible chemical reactions (such as gas–solid sorption or endothermic/exothermic reactions) that lock heat in chemical bonds.
Among these, thermochemical storage stands out for its exceptional energy density and low losses [8]. By using reversible salt–gas or chemical reactions, TCM can store heat at very high volumetric density while heat is held in chemical form with minimal losses over long periods [9,10]. This makes TCM attractive for seasonal or long-duration storage and compact applications (like residential applications). Thermochemical reactors can achieve storage densities in the order of 100 to 600 kWh/m3 [9,11], far exceeding the 20–30 kWh/m3 typically found in water storage tanks [7]. However, thermochemical systems also face significant challenges. They often require expensive materials and complex reactors while heat/mass transfer limitations in reactors can restrict performance. Practical issues such as the slow reaction kinetics of solid–gas sorption, material degradation, and crystallization further complicate operation [6,7].
Recent research has begun to address these issues, especially regarding solar-driven TCM systems. Several experimental and modeling studies have focused on calcium chloride–ammonia (CaCl2–NH3) systems and related halide salts. For example, An et al. (2022) carried out an experimental comparison of sorption cycles and found that, under high-temperature solar input (≈175 °C), a single-stage CaCl2–NH3 sorption cycle delivered the best discharge performance among various tested configurations [12]. In simulations, Korkua et al. (2024) optimized a SrCl2–NH3/expanded-graphite sorbent system (analogous to CaCl2) coupled to hybrid photovoltaic-thermal (PVT) collectors: they showed that tuning the salt compression ratio and heat-transfer conditions can significantly improve cycle efficiency and stability [13]. Other studies have integrated thermochemical reactors with heat pumps to ensure high performance [14], while Mehari et al. (2022) designed a cycle that works in cold regions with ambient temperatures below −10 °C [15].
In this context, the MiniStor (“Minimal Size Thermal and Electrical Storage”) Horizon project [16] led by CERTH/CPERI and partners has developed a compact, solar-driven thermochemical energy storage system for buildings. The MiniStor prototype combines a CaCl2–NH3 thermochemical reactor with latent heat modules (for cooling and heating) with an integrated solar field. Notably, the reactor with the PCM combination achieves an extremely high storage density (~213 kWh/m3), roughly an order of magnitude greater than a conventional water tank [17]. The unit (containerized at 3.5×2.5×2.7 m) is paired with custom photovoltaic-thermal (PVT) and solar thermal collectors that provide the heat and power needed to drive the ammonia–salt reaction [17]. MiniStor systems are currently being field-tested in residential demonstrators across Europe – for example in Cork, Ireland, as well as in Spain, Greece and Hungary [18]. These installations are explicitly chosen to span diverse weather conditions and building configurations.
In this paper, the feasibility of the MiniStor system under a variety of climate conditions is assessed, while at the same time different strategies are assessed to optimize its performance for covering the heating and cooling demand in different building typologies. The performance evaluation of MiniStor is based on a dynamic model of the system including the solar field, developed in Aspen Plus Dynamics and integrated with MATLAB/Simulink [11,19]. Results for the annual covered heating, cooling and electricity demand are provided.
The MiniStor system is made up of four key sub-systems that work together to provide both thermal and electrical energy. First, it includes photovoltaic-thermal (PVT) and solar thermal collectors, supported by a buffer tank, which are responsible for generating the necessary heat. Second, it features a TCM reactor that operates with an ammonia cycle to store and release thermal energy. The third sub-system combines a heat pump with PCM storages—one for hot and one for cold thermal energy—ensuring efficient temperature management. Lastly, the system incorporates a battery that stores electricity produced by the PVT panels via an inverter. This battery supplies power to all essential electrical components of the system such as pumps and compressors. An overview of all system components of the MiniStor system and their integration into the building’s HVAC system is presented in Figure 1.

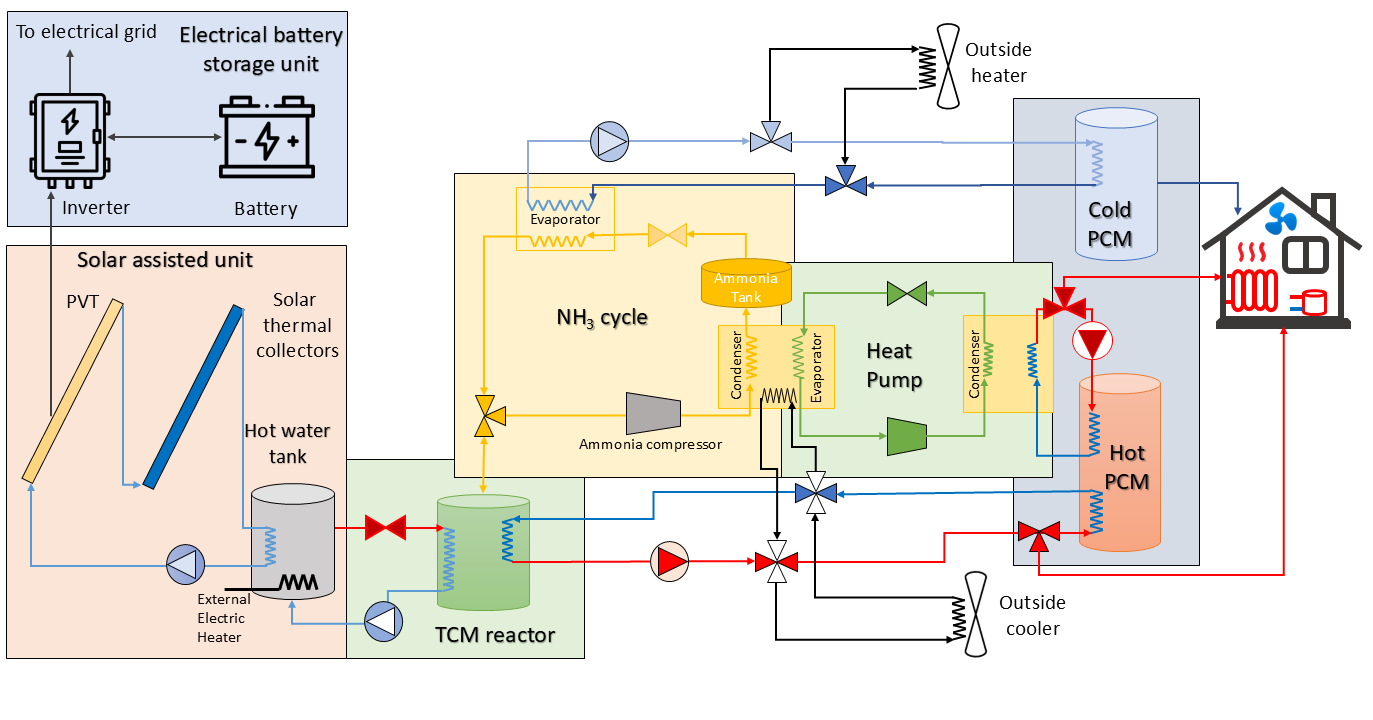
Figure 1 Overview of MiniStor system components.
At the heart of MiniStor lies the TCM reactor, a novel unit designed for dense heat storage using a solid-gas sorption process. The underlying chemistry involves reversible reactions between ammonia and calcium chloride, with the salt initially in the form CaCl2·4NH3. These reactions enable significant thermal energy storage and release due to the high sorbate absorption per mass of salt. During the winter months, the MiniStor system provides heating through two operating modes. In the charging mode, solar energy captured by the solar field is primarily used to supply the heat needed for desorbing ammonia from the thermochemical salts. When solar heat is insufficient, a 2-kW electric backup heater supplements the heat input. Once the TCM reactor reaches the required temperature, the pressure rises, initiating the endothermic decomposition reactions that release ammonia gas. This gas is then compressed, condensed, and stored in liquid form. To meet the building's heating needs, the heat released during condensation is further upgraded by a heat pump to reach temperatures around 63 °C. In the discharging mode—which takes place during winter nights, cloudy days, and in the summer—the stored liquid ammonia is allowed to evaporate when the pressure in the reactor drops below the ammonia's evaporation pressure. This causes ammonia to flow to the evaporator, where it vaporizes at ambient-dependent temperatures. When the gaseous ammonia enters the reactor, it undergoes an exothermic reaction that releases heat at 57–63 °C. This thermal energy is then either used directly for space heating or stored in the hot PCM. Additionally, during the summer, the cooling effect from ammonia evaporation is used to partially meet the building’s cooling demand. The resulting cooling output is stored in the cold PCM, which has a melting point of 11 °C.
The solar array driving the system consists of ten photovoltaic-thermal (PVT) panels and five flat-plate collectors (FPCs), all installed at an optimal tilt facing south. Each PVT panel combines high-efficiency monocrystalline silicon cells with thermal absorbers and offers an aperture area of 1.55 m2, delivering a maximum electrical output of 260 W. Their optical and thermal loss characteristics are also optimized for dual energy generation. The FPCs, each with a gross area of 2.37 m2, an optical efficiency of 0.823 and heat loss coefficients α1=3.36 (W/m2K) and α2=0.013 (W/m2K) respectively. To prevent overheating, an external heat exchanger cools the heat transfer fluid if necessary.
A small buffer tank and the backup heater are integrated into the system to stabilize the heat supply, especially important for meeting the TCM reactor's temperature threshold of 56 °C. An automated control system regulates the heat recirculation pump based on the solar output and buffer tank temperature. Meanwhile, electricity generated by the PVTs is managed by a hybrid inverter that allocates power between the MiniStor system, building demands, and the electrical grid. Excess power can be stored in lithium-ion batteries, which offer 7.68 kWh of capacity with high efficiency. A more detailed description of the MiniStor operation including temperature and pressure ranges may be found in previous work [19,20].
Section 2.2 outlines a detailed methodology for assessing the replication technical potential of the MiniStor system. This methodology includes the selection of EU regions with harsh climatic conditions and the evaluation of suitable building typologies. The system's performance under different environmental conditions is assessed using simulation results based on the MATLAB/ASPEN model described by Zisopoulos [11,19].
The first step involves identifying sites with climatic conditions that cover most of the EU. Given that extreme temperatures, precipitation, and wind events can significantly influence HVAC system performance, sites with particularly harsh climatic conditions were also included. In the context of MiniStor, harsh climates are defined as those with cold winters and moderate solar radiation potential.
The Köppen-Geiger climate classification system [21] was employed to categorize the selected sites. This system divides climates into five main groups—tropical (A), arid (B), temperate (C), cold (D), and polar (E)—with further subdivisions based on precipitation and temperature characteristics. For instance, a Cfc classification denotes a temperate climate with a cold summer, whereas Cfb indicates a temperate climate with a warm summer.
Locations including Larnaca, Athens, Rome, Porto, Paris, Krakow, Berlin, Hamburg, and Bergen were selected to ensure broad geographical distribution, distinct climate characteristics, and strong market potential based on residential building stock. According to the EU Building Stock Observatory (2024) [22], Germany, France, and Italy together represent over 50% of the EU’s residential floor area. Cyprus was also included to examine system performance under hot, semi-arid conditions. Collectively, the selected seven countries (Cyprus, France, Germany, Greece, Italy, Poland, Portugal) represent over 60% of the EU’s residential building stock (18,408 million m2). Norway was also incorporated to evaluate performance in extreme cold climates. The selected cities and their key climatic parameters are listed in Table 1. The necessary data for temperature and degree day calculations were sourced from the Meteonorm database [23].
Table 1 Selected sites for investigating the applicability of the Ministor system under different climatic conditions and characteristics of their climate.

Heating Degree Days (HDD) and Cooling Degree Days (CDD) are essential metrics for estimating heating and cooling demands. They are calculated based on the mean daily temperature relative to a baseline—15 °C for heating and 24 °C for cooling—according to the following formulas [24,25]:
where, Tim = the mean daily temperature of day i. This is determined as the arithmetic mean value of the daily maximum (Tmax) and the daily minimum temperature (Tmin) Tm = (Tmax + Tmin)/2 [26].
To assess the replication potential of the MiniStor system, its applicability was evaluated across different sites and climatic conditions by selecting suitable building typologies for each of the cities and countries identified in the previous Section. The TABULA Web Tool [27,28] was utilized for this purpose. Developed under the projects “TABULA” (2009) and “EPISCOPE” (2013), the tool provides detailed national residential building typologies across Europe, enabling experts to access standardized data on construction methods, thermal transmittance values, common building systems, and energy consumption patterns.
For the replication analysis, a single-family house (SFH), either detached or semi-detached, was chosen as the representative building typology for each site. This selection was guided by the similarity to the pre-pilot building (the Smart Home of CERTH/ITI [18] in which Ministor has been installed and monitored, and the practical benefits of single-family homes, such as the availability of space for system components.
Using the TABULA database, a suitable recent construction typology was selected for each city. Key criteria included building size, construction materials, architectural style, and energy efficiency features, aiming to align closely with the characteristics of the Smart Home. For each typology, data on total (whole building) U-values, which incorporate both transmission and ventilation losses, were extracted, alongside reference floor area and period of construction. These are summarized in Table 2.
Table 2 TABULA category and period of construction for each selected site location along with basic energy consumption data.
It should be noted that no TABULA data exist for Portugal; therefore, equivalent building information was sourced from EPBD Portugal [29].
The heating and cooling loads for these buildings were estimated based on their U-values, reference areas, and the local climatic conditions determined previously. For time-dependent calculations, the following equations were applied:
where Aref is the reference floor area, i= [1,tend] is the time step, Um is the average whole building U-value considering transmission and ventilation losses, Ti is the indoor design temperature, Tb is the external temperature at time step i.
For a simplified annual estimation, Heating Degree Days (HDD) and Cooling Degree Days (CDD) were used with the following formulas:
where QH and QC are the annual heating and cooling loads respectively. The resulting annual heating and cooling loads for each building typology are presented in Table 2.
To evaluate the broader technical replication potential, the share of single-family dwellings in each country was considered. According to the European Building Stock Analysis by Eurac Research [30], the share of single-family and terraced houses varies between 29% and 91% across the studied countries: 29% in Italy, 48% in France, 68% in Greece, 71% in Germany, 76% in Poland, 86% in Portugal, and 91% in Cyprus. Further focusing on recently built dwellings (post-2010) to align with the TABULA typologies, the share of newer constructions ranged from 4% to 12%, 4% in Germany, 5% in Greece, 7% in Portugal, 10% in Cyprus, and 12% in Italy, France, and Poland. Based on these data, it is estimated that the assessed typologies collectively represent approximately 504 million m2 of floor area where the MiniStor system could potentially be deployed.
This section outlines the methodology applied to assess the technical potential for replicating the MiniStor system. The methodology is structured in five key steps:
(1) Site Selection:
The selected locations for the applicability study of the MiniStor system are presented in Table 1.
(2) Building Typology Identification:
Representative building typologies were identified for each location, as described in Section 2.2.2. Based on these typologies, heating and cooling loads were calculated using Equations 5 and 6.
(3) Definition of a Representative Time Period:
Since the MiniStor system simulations are limited to representative days due to computational constraints, a typical period covering a full cycle of charging and discharging (typically two to three days) was determined for both winter and summer conditions.
(4) Input Data Definition:
Additional inputs related to the solar field configuration and system operation such as collector layouts, mass flow rates between system components, and operating pressures were defined based on prior system specifications. Table 3 summarizes the main input and output variables considered in the current simulation analysis, along with their respective units.
Table 3 Main input and output variables considered in the simulation analysis.
(5) Simulation and Optimization:
At first, the analysis assumes a conservative worst-case scenario where both the TCM and PCM storage tanks are initially empty. However, in practical applications pre-charged storage would enhance system performance. Therefore, an optimized discharging strategy where the discharge initiates first is also examined to demonstrate MiniStor's full capability in meeting heating and cooling demands. In this scenario, the TCM reactor is discharged at night when residential heating demand is highest, the PCM tank is discharged to meet early morning heating loads and the TCM reactor is recharged using solar heat, while a heat pump covers heating demand and simultaneously charges the PCM tank. The proposed optimization is based on optimizing the control and operation of the existing system without any changes in its hardware and on typical strategies for thermal storage systems as seen in the literature [31–33].
The entire procedure, including the MiniStor model, has been incorporated into a custom MATLAB tool, facilitating the replication of the MiniStor system for any location with available meteorological and building typology data. Since Steps 1 and 2 are detailed in Sections 2.2.1 and 2.2.2, the remainder of this section focuses on the procedure for defining the typical time periods.
Following the approach described in [11,19], representative periods for winter and summer were identified based on outdoor temperatures, Heating Degree Days (HDD), Cooling Degree Days (CDD), and available solar radiation:
(1) For each day of the Typical Meteorological Year (TMY), daily HDD, CDD, and solar radiation on a tilted surface were calculated. TMY data was sourced from the Meteonorm database, known for its high reliability based on station-derived measurements.
(2) A variable was calculated for each day, representing deviations in HDD, CDD, and solar radiation from their respective seasonal averages.
(3) The variable values were summed over three-day periods, corresponding to a full MiniStor charge/discharge cycle.
(4) The three-day period with the lowest variable value was selected as the representative period for the simulation.
This procedure identified typical heating and cooling periods for all cities. Generally, the maximum length for a representative cycle was three days. The full methodology, including the steps for finding the representative periods, is depicted in Figure 2. The heating and cooling durations, for each city, are presented in Table 4. The heating and cooling profiles were further refined by considering solar radiation and ambient temperature values, interpolated from hourly TMY data to 15-minute intervals to match the required time step of the MiniStor model.
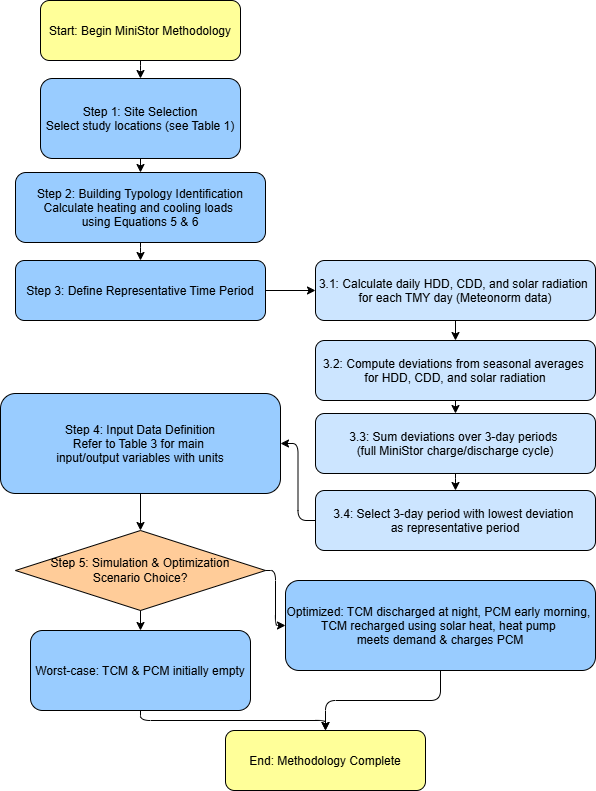
Figure 2 Methodology flowchart for the MiniStor system replication analysis.
Table 4 Typical heating and cooling period for each city.
For Step 4, system parameters—such as the thermal and electrical capacities of the solar field—were adopted from the Thessaloniki pre-demonstration site and may be found in [19,20]. In addition, the system model incorporates several essential parameters: the PI controller settings (Table 6 in [11]), including temperature and pressure setpoints; the initial input values and operating conditions of the thermochemical material (TCM) reactors; and the phase change material (PCM) storage tank characteristics, such as phase change temperature and energy density (Table 7 in [11]). The complete list of system parameters is not included here for brevity; however, all parameters are available in [19]. The default solar field layout consists of three rows: two rows with five solar photovoltaic-thermal (PVT) hybrid panels each, and one row with five solar flat plate collectors (FPCs). The system's total installed thermal capacity is 16 kWth, with a peak electrical output of 2.65 kWe.
The main difference in this analysis compared to the MiniStor model described in [19] is the approach used to estimate photovoltaic (PV) energy generation. Instead of relying on the MiniStor model, annual solar electricity generation was calculated using the Photovoltaic Geographical Information System (PVGIS) [34]. Developed by the Joint Research Centre (JRC) of the European Commission, PVGIS is a widely recognized tool for estimating solar radiation and PV performance across Europe, offering detailed data on solar irradiance, temperature, and meteorological conditions. PVGIS has been extensively used by researchers to assess PV performance across diverse climates and by policymakers for strategic renewable energy planning [34,35]. In this study, PVGIS data and MiniStor system parameters were combined under the following assumptions:
(1) Optimal panel tilt for each location,
(2) 13% system energy losses,
(3) Data sourced from the PVGIS-SARAH2 database, and
(4) PVT panel specifications.
PVGIS was preferred over the MiniStor model due to its ability to provide full-year energy estimates, whereas the MiniStor simulations are limited to short 2 to 3-day cycles. For evaluating year-round feasibility, PVGIS offers significantly higher accuracy. Finally, the MiniStor model simulations were performed for all cities using their corresponding heating and cooling periods and covering the worst-case as well as the optimized scenario. The results are presented in the next Section.
This analysis assesses the MiniStor performance across the selected cities. This section is structured into two parts. First, the heating and cooling performance of MiniStor across all cities is presented, both with and without auxiliary electricity support. Then, the annual heating, cooling, and electricity coverage results are discussed, based on MiniStor model simulations. These annual results are evaluated under two scenarios: a worst-case scenario starting with empty TCM and PCM storage tanks, and an optimized scenario, enabling a direct comparison between the two.
The results primarily focus on the heating and cooling load coverage achieved through solar or renewable energy sources (RES) and auxiliary electricity, along with the state of charge (SOC) for the PCM storage relative to the thermal loads. Heat load coverage by solar energy is defined as the ratio of heat supplied by MiniStor, charged via solar or other RES, to the total heating demand. Conversely, heat load coverage by auxiliary electricity refers to the proportion of heating demand met through MiniStor when charged from the electricity grid or, where possible, from surplus PVT-generated electricity via virtual net-metering. The MiniStor system’s electricity consumption mainly covers the operation of the ammonia compressor, the heat pump compressor, and the backup electric heater.
All simulations are carried out over a full MiniStor charge/discharge cycle (typically lasting two days), which represents a methodological limitation of the current analysis.
This section presents the MiniStor system results for the cities analyzed in Section 2. The system configuration follows [19], with the solar field setup modeled after the Thessaloniki pre-demo site. Results are reported for Athens, Bergen, Berlin, Hamburg, Krakow, Larnaca, Paris, Porto and Rome. The heating and the cooling season correspond to the average winter and summer period respectively, defined in Table 4.
Figure 3 depicts the heating operation performance with and without auxiliary electricity, including the heat load coverage for a full cycle. In Bergen, Berlin, Krakow, Hamburg, and Paris, insufficient solar radiation prevents full charging, resulting in minimal heat load coverage by solar energy and the need for auxiliary grid electricity. Conversely, in Athens, Larnaca, Porto, and Rome, solar radiation is sufficient for completing the cycle, with Athens achieving the highest solar heat coverage, followed by Larnaca and Porto. Rome shows lower coverage due to longer cycles and higher heating demands. Limited auxiliary electricity could further enhance system coverage in these cases.
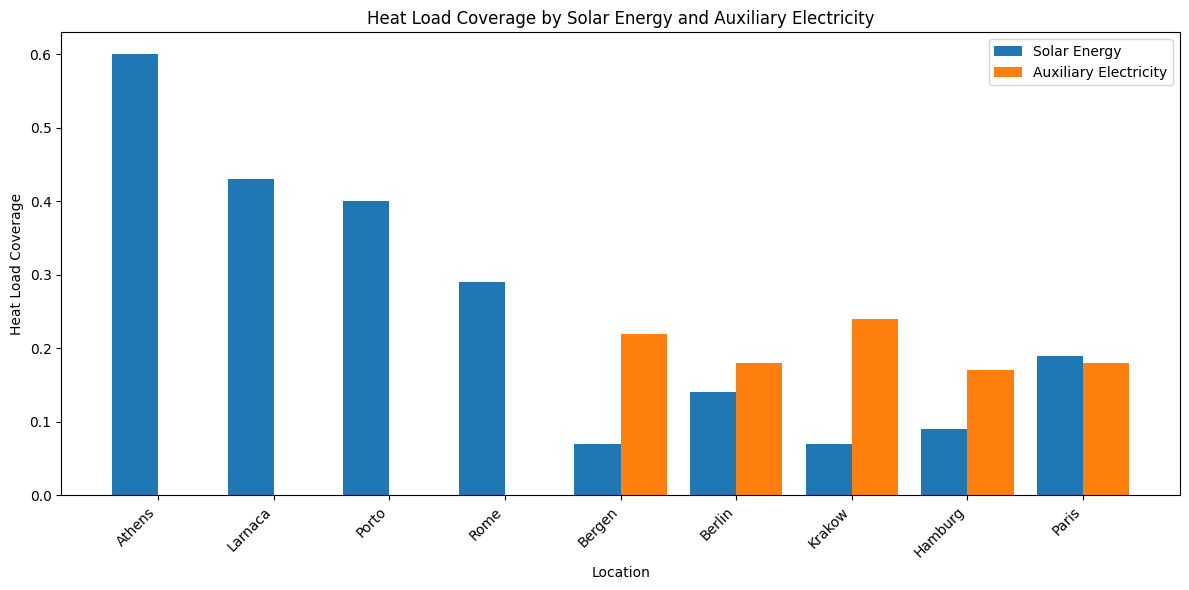
Figure 3 Heat load coverage for buildings in selected cities for replication with and without using auxiliary electricity.
Charging depends on solar availability and auxiliary electricity, while discharging depends mainly on building load profiles. In colder climates (e.g., Berlin, Krakow, Paris), solar heat coverage ranges from 0.07 to 0.19, with the system having a higher reliance on auxiliary electricity.
Table 5 presents results for the cooling operation. It includes total cooling demands per cycle, cooling load coverage covered by solar energy, and cycle completion time. Charging during the cooling season relies exclusively on solar energy. Results show that higher solar radiation accelerates charging and shortens cycle durations. Cooling coverage also varies, with Rome achieving the highest (0.78) and Larnace the lowest (0.46). In Rome, higher coverage is due to a favorable balance of strong solar radiation and moderate cooling loads, while Larnaca's cooling needs are much higher.
Table 5 Cooling load coverage for buildings in selected cities for replication.
To evaluate MiniStor's ability to meet annual heating and cooling demands using solar energy, the annual heating and cooling data from Table 4 and the simulation results from the previous Section are utilized. First, the hourly coverage rate of MiniStor during a typical full charging/discharging cycle was calculated and then applied to the annual demand to estimate the total annual covered heating and cooling loads. Annual electricity production values were obtained from PVGIS 5.2.
Table 6 presents the annual energy performance under the typical (or the worst-case) scenario. In Athens, Larnaca, Rome, and Porto, MiniStor’s solar field can charge the TCM reactor without auxiliary electricity. The RES coverage ranges from 53% to 88%. Electricity production during the year is similar across Athens, Rome, and Porto, reflecting similar solar field configurations, solar radiation, and heating/cooling periods.
Table 6 Annual heating and cooling demand coverage by RES - typical scenario.
Results for Paris, Krakow, Berlin, Hamburg, and Bergen are also included. In these cases, TCM reactor charging relies on both solar energy and auxiliary electricity. Lower solar contributions are noted in harsher climates, with Paris achieving 60% RES coverage, Berlin and Hamburg achieving 39% and 36% RES coverage respectively.
Larnaca records the highest annual production (4,680 kWh/year), while Bergen showed minimal output. Notably, in cities without MiniStor cooling operation (Bergen, Berlin, Hamburg, Krakow, Porto,), surplus electricity during summer is injected into the grid. Conversely, during heating periods, on-site electricity production is generally insufficient to cover MiniStor’s electricity needs, requiring grid supplementation.
Krakow shows the highest heating demand (25,575 kWh/year), followed by Hamburg, while Porto exhibits the lowest (7,946 kWh/year). Cooling demands are highest in Larnaca, while minimal in northern cities like Berlin and Bergen. In some locations, the integration of solar and electric heating significantly boosts heating coverage (e.g., Paris from 2,663 to 5,186 kWh/year), whereas cities like Bergen depend mainly on auxiliary electricity.
As MiniStor primarily targets heating applications, cooling coverage is considered supplementary, enhancing the system’s economic viability. Since cooling loads are minimal or nonexistent in many cities (Table 4), results are presented only for Athens, Larnaca, and Rome. Cooling operation relies entirely on solar heat, with no backup electricity heater needed. MiniStor covers between 33% and 100% of annual cooling needs in these southern cities.
`The results discussed thus far are based on the worst-case scenario, demonstrating that MiniStor performs satisfactorily even under the most adverse conditions. However, in real-world applications, systems typically start with fully charged TCM and PCM storage tanks. Therefore, an optimal operating strategy, where discharging precedes recharging, was also evaluated to better reflect practical performance.
In the optimal scenario, the TCM reactor discharges at night to meet peak heating demands, while the PCM tank addresses early morning loads. Solar heat then recharges the TCM reactor during the day, with the heat pump simultaneously supporting heating demand and charging the PCM tank. This strategy maximizes system efficiency by synchronizing energy storage and demand patterns.
Due to the complexity of the optimization, representative cities—Athens, Bergen, Hamburg, Larnaca, and Rome—were selected for simulation, considering both cases with and without auxiliary electricity. Table 7 compares typical and optimal scenarios across the five cities, focusing on heating demand covered by solar energy, total heating and cooling demand covered, and the overall RES energy coverage ratio. In Athens, optimization increased heating coverage by solar energy from 4,456 to 5,199 kWh/year, and nearly doubled the covered cooling demand, raising the total RES coverage ratio from 53% to 65%. Larnaca exhibited the most significant gains, with heating coverage nearly doubling and cooling coverage rising substantially, resulting in an RES coverage ratio exceeding 100%, indicating periods of energy surplus.
Table 7 Annual heating and cooling demand coverage by RES: typical vs. optimal scenarios.
Bergen and Hamburg showed limited improvement, with RES coverage increasing marginally due to less favorable climatic conditions. In Rome, optimization improved heating coverage from 3,931 to 6,100 kWh/year and cooling coverage from 1,286 to 1,649 kWh/year, increasing the overall RES ratio from 72% to 91%.
In summary, under the optimal operation, heat load coverage improved by 3% to 40%, with Larnaca showing the highest increase. The cooling performance under optimal operation was also assessed for Athens and Larnaca. Discharging began at dawn, aligning with rising cooling demands. In Athens, cooling needs were fully met (100%) through optimized use of TCM and PCM, while Larnaca achieved 87% coverage. Overall, the optimized strategy allowed discharging/charging cycles to complete within a single day, significantly enhancing performance in warmer climates.
The analysis evaluated the MiniStor system’s heating and cooling performance across various European cities. Two scenarios were assessed: a worst-case scenario with empty storage tanks and an optimized one with pre-charged tanks. Heating and cooling coverage were compared with and without auxiliary electricity. Results showed that cities with higher solar availability, like Athens, Larnaca, and Porto, achieved strong solar heating coverage, while colder cities like Berlin and Paris relied more heavily on grid electricity. Cooling operations depended entirely on solar energy, with Rome showing the highest solar cooling coverage while Hamburg and Bergen showed lower solar contributions during heating due to harsher climates.
Annual performance studies further revealed that MiniStor could cover 53–88% of energy demands through renewables in sunnier cities under typical operation, with significantly improved results under optimized conditions. Optimization strategies, which synchronized storage discharge and recharge with daily heating and cooling needs, greatly boosted renewable energy coverage — in some cases exceeding 100% due to surplus production. Warm-climate cities like Larnaca and Athens benefited the most, achieving nearly full coverage for both heating and cooling, while colder cities like Bergen saw only modest improvements. Overall, the MiniStor system demonstrated strong potential to meet building energy demands sustainably, particularly when deployed with optimized operational strategies.
In order to enhance performance in areas with poor solar potential, the MiniStor system's next research phase will concentrate on hybrid integration with other renewable energy sources and seasonal storage options. Along with investigating the scalability across various building types and community-level applications, a thorough techno-economic life cycle analysis and life cycle cost study would also help to strengthen the system's sustainability and practicality while guaranteeing resilience in harsh environments.
Not applicable.
Not applicable.
Dataset are available on request from the authors.
This paper was prepared in the context of the European Union's Horizon 2020 research and innovation program through grant agreement No 869821 (Minimal Size Thermal and Electrical Energy Storage System for In-Situ Residential Installation - MiniStor).
The authors have declared that no competing interests exist.
Conceptualization: G.M. and N.N.; Methodology: A.T. and G.M.; Software: A.T.; Validation: A.T. and G.M.; Formal Analysis: A.T. and G.M.; Investigation: A.T. and G.M.; Resources: A.T. and G.M.; Data Curation: A.T.; Writing – Original Draft: A.T. and G.M.; Writing – Review & Editing: G.M. and N.N.; Visualization: A.T.; Supervision: G.M. and N.N.; Project Administration: G.M. and N.N.; Funding Acquisition: N.N.
Not applicable.
The following abbreviations are used in this manuscript:
| 1. | Directorate-General for Energy. Heating and cooling [Internet]. [cited 2025 May 5]. Available from: https://energy.ec.europa.eu/topics/energy-efficiency/heating-and-cooling_en. |
| 2. | European Environment Agency. Share of energy consumption from renewable sources in Europe [Internet]; 2025 Jan 16 [cited 2025 May 5]. Available from: https://www.eea.europa.eu/en/analysis/indicators/share-of-energy-consumption-from. |
| 3. | Buildings Performance Institute Europe. EU Buildings Climate Tracker 3rd edition [Internet]; 2024 Nov 27 [cited 2025 May 5]. Available from: https://www.bpie.eu/publication/eu-buildings-climate-tracker-3rd-edition/. |
| 4. | Martinopoulos G. Are rooftop photovoltaic systems a sustainable solution for Europe? A life cycle impact assessment and cost analysis. Appl Energy. 2020;257:114035. [Google Scholar] [CrossRef] |
| 5. | Duffie JA, Beckman WA, Blair N. Solar Engineering of Thermal Processes, Photovoltaics and Wind. Solar Engineering of Thermal Processes, Photovoltaics and Wind. 4th ed. Wiley; 2020. [CrossRef] |
| 6. | Gbenou T, Fopah-Lele A, Wang K. Recent Status and Prospects on Thermochemical Heat Storage Processes and Applications. Entropy. 2021;23(8):953. [Google Scholar] [CrossRef] |
| 7. | Dinçer I, Rosen MA. Thermal Energy Storage: Systems and Applications, Second Edition. Thermal Energy Storage: Systems and Applications. 2nd Ed. Wiley; 2010. [CrossRef] |
| 8. | Michel B, Neveu P, Mazet N. Comparison of closed and open thermochemical processes, for long-term thermal energy storage applications. Energy. 2014;72:702-716. [Google Scholar] [CrossRef] |
| 9. | Abdullah Koushaeian M, Shah NA, Chung JD. A review on thermochemical seasonal solar energy storage materials and modeling methods. Int J Air-Cond Refrig. 2024;32(1):1. [Google Scholar] [CrossRef] |
| 10. | Mette B, Kerskes H, Drück H. Concepts of long-term thermochemical energy storage for solar thermal applications - Selected examples. Energy Procedia. 2012;30:321-330. [Google Scholar] [CrossRef] |
| 11. | Zisopoulos G, Nesiadis A, Atsonios K, Nikolopoulos N, Stitou D, Coca-Ortegón A. Conceptual design and dynamic simulation of an integrated solar driven thermal system with thermochemical energy storage for heating and cooling. J Energy Storage. 2021;41:102870. [Google Scholar] [CrossRef] |
| 12. | An GL, Wu SF, Wang LW, Zhang C, Zhang B. Comparative investigations of sorption/resorption/cascading cycles for long-term thermal energy storage. Appl Energy. 2022;306:117991. [Google Scholar] [CrossRef] |
| 13. | Korkua SK, Thubsuang U, Sakphrom S, Dash SK, Tesanu C, Thinsurat K. Simulation-Driven Optimization of Thermochemical Energy Storage in SrCl2-Based System for Integration with Solar Energy Technology. Inventions. 2025;10(1):9. [Google Scholar] [CrossRef] |
| 14. | You J, Gao J, Li R, Wang R, Xu Z. Air-source heat pump assisted absorption heat storage for discharging under low ambient temperature. Appl Energy. 2025;380:125121. [Google Scholar] [CrossRef] |
| 15. | Mehari A, Zhang WY, Chen XH, Zheng X, Pan QW, Zhang XJ, et al. A thermal and mass couple assisted ammonia sorption heat storage with enhanced cooling and heating supply. Appl Therm Eng. 2025;271:126367. [Google Scholar] [CrossRef] |
| 16. | MiniStor [Internet]. Ireland: International Energy Research Centre (IERC), Tyndall National Institute (University College Cork). [cited 2025 May 5]. Available from: https://ministor.eu/. [Google Scholar] |
| 17. | MiniStor project [Internet]. UK: Pantograf Media Ltd.. [cited 2025 May 5]. Available from: https://europeanenergyinnovation.eu/Latest-Research/Summer-2024/MiniStor-project. [Google Scholar] |
| 18. | Demostration Sites – MiniStor [Internet]. Ireland: International Energy Research Centre (IERC), Tyndall National Institute (University College Cork). [cited 2024 Nov 18]. Available from: https://ministor.eu/demosites/. [Google Scholar] |
| 19. | D3.1 Initial dimensioning of the system according to general use typologies [Internet]; 2023 [cited 2025 May 5]. Available from: https://ministor.eu/wp-content/uploads/2024/12/D3_1-Initial-Dimensioning-of-the-System_as-approved.pdf. |
| 20. | Tsimpoukis A, Martinopoulos G, Nikolopoulos N. Analysis of a novel compact integrated thermal energy storage system (MiniStor) in European sites. In: Bertoldi P, Joint Research Centre (European Commission), editors. 12th international conference on improving energy efficiency in commercial buildings and smart communities [Internet]. Luxembourg: Publications Office of the European Union; 2024. p. 3–16. [cited 2024 Nov 18]. Available from:https://data.europa.eu/doi/10.2760/716916. |
| 21. | Beck HE, Zimmermann NE, McVicar TR, Vergopolan N, Berg A, Wood EF. Present and future köppen-geiger climate classification maps at 1-km resolution. Sci Data. 2018;5:180214. [Google Scholar] [CrossRef] |
| 22. | EU Building Stock Observatory - Factsheets [Internet]. European Commission. [cited 2025 May 5]. Available from: https://building-stock-observatory.energy.ec.europa.eu/factsheets/. |
| 23. | Meteotest. Software Meteonorm [software]; 2023 [cited 2025 May 5]. Available from: https://meteonorm.com/. |
| 24. | Energy statistics - cooling and heating degree days [Internet]. Luxembourg: Eurostat. [cited 2025 May 5]. Available from: https://ec.europa.eu/eurostat/cache/metadata/en/nrg_chdd_esms.htm. [Google Scholar] |
| 25. | Kajewska-Szkudlarek J. Predictive modelling of heating and cooling degree hour indexes for residential buildings based on outdoor air temperature variability. Sci Rep. 2023;13(1):17411. [Google Scholar] [CrossRef] |
| 26. | ASHRAE. ASHRAE Handbook—Fundamentals (SI). ASHRAE Handbook—Fundamentals (SI). 2005. [Google Scholar] |
| 27. | TABULA WebTool [Internet]. TABULA. [cited 2025 May 5]. Available from: https://webtool.building-typology.eu/#bm. |
| 28. | Loga T, Stein B, Diefenbach N. TABULA building typologies in 20 European countries—Making energy-related features of residential building stocks comparable. Energy Build. 2016;132:4-12. [Google Scholar] [CrossRef] |
| 29. | EPBD Portugal [Internet]; 2018 [cited 2025 May 5]. Available from: epbd-ca.eu/outcomes/2015-2018/book2018/countries/portugal/. |
| 30. | Gevorgian A, Pezzutto S, Zambotti S, Croce S, Filippi Oberegger U, Lollini R, et al. European Building Stock Analysis A country by country descriptive and comparative analysis of the energy performance of buildings [Internet]; 2021 [cited 2025 May 5]; Available from: https://webassets.eurac.edu/31538/1643788710-ebsa_web_2.pdf. |
| 31. | Rosato A, El Youssef M, Daoud H, Al-Salaymeh A, Ghorab MG. TRNSYS dynamic digital twin of hot and cold sensible thermal energy storages: An experimental calibration and validation approach. J Energy Storage. 2025;105:114700. [Google Scholar] [CrossRef] |
| 32. | Pinel P, Cruickshank CA, Beausoleil-Morrison I, Wills A. A review of available methods for seasonal storage of solar thermal energy in residential applications. Renew Sustain Energy Rev. 2011;15:3341-3359. [Google Scholar] [CrossRef] |
| 33. | Antoniadis CN, Martinopoulos G. Optimization of a building integrated solar thermal system with seasonal storage using TRNSYS. Renew Energy. 2019;137:56-66. [Google Scholar] [CrossRef] |
| 34. | Huld T, Müller R, Gambardella A. A new solar radiation database for estimating PV performance in Europe and Africa. Solar Energy. 2012;86(6):1803-1815. [Google Scholar] [CrossRef] |
| 35. | Huld T, Gracia Amillo AM. Estimating PV module performance over large geographical regions: The role of irradiance, air temperature, wind speed and solar spectrum. Energies (Basel). 2015;8(6):5159-5181. [Google Scholar] [CrossRef] |

![]()
Copyright © 2026 Pivot Science Publications Corp. - unless otherwise stated | Terms and Conditions | Privacy Policy


