
Green Energy and Sustainability ISSN 2771-1641
Green Energy and Sustainability 2025;5(4):0008 | https://doi.org/10.47248/ges2505040008
Original Research Open Access
Leveraging TRNSYS simulations of a single family house in Spain for renewable energy integration
George Dogkas
1

 ,
Alexandros Tsimpoukis
1
,
Milen Pérez Cammañ
2
,
Jesús Samaniego Muñoz
2
,
Juan Carlos del Castillo Garcia
2
,
Ola Gustafsson
3
,
Grigorios Itskos
1
,
Nikolaos Nikolopoulos
1
,
Alexandros Tsimpoukis
1
,
Milen Pérez Cammañ
2
,
Jesús Samaniego Muñoz
2
,
Juan Carlos del Castillo Garcia
2
,
Ola Gustafsson
3
,
Grigorios Itskos
1
,
Nikolaos Nikolopoulos
1
Correspondence: George Dogkas
Academic Editor(s): Tony Roskilly, Georgios Martinopoulos, Georgia Kastrinaki, Hande Eryilmaz, Martin Roeb
Received: Aug 5, 2025 | Accepted: Oct 3, 2025 | Published: Oct 9, 2025
This article belongs to the Special Issue Selected Papers from the Conference ICRES 2025
© 2025 by the author(s). This is an Open Access article distributed under the terms of the Creative Commons License Attribution 4.0 International (CC BY 4.0), which permits unrestricted use, distribution, and reproduction in any medium or format, provided the original work is correctly credited.
Cite this article: Dogkas G, Tsimpoukis A, Cammañ MP, Samaniego Muñoz J, Garcia JCC, Gustafsson O, Itskos G, Nikolopoulos N. Leveraging TRNSYS simulations of a single family house in Spain for renewable energy integration. Green Energy Sustain. 2025;5(4):0008. https://doi.org/10.47248/ges2505040008
A dynamic model was developed in TRNSYS® software package to simulate the thermal behavior of a single family house in Spain during a year. The model takes into consideration the characteristics of the building (orientation, insulation, thermal zones, etc.), heating and cooling devices, weather conditions and electric grid usage. Additionally, the model incorporates occupancy profiles, lighting, heat producing devices and infiltration to estimate thermal loads and photovoltaic production. So, with the utilization of the model, a characterization of the thermal and photovoltaic systems is accomplished, which can be used for the assessment of potential coupling with individual models of thermal energy storage solutions and comparison of cases with and without storage. As a result, the investigation of load shift strategies together with the exploitation of the photovoltaic energy source, will be feasible if the required input becomes available. According to the model, the annual thermal demands are 1618 kWh for space heating, 2358 kWh for space cooling and 1671 kWh for domestic hot water. The total electricity consumption of the heat pump and all circulating pumps is 1273 kWh, while the photovoltaic array produces 6512 kWh per year.
KeywordsTRNSYS, photovoltaic, building, thermal storage, thermal demand, space heating, heat pump
Residential buildings thermal demand is the major energy demand in the European Union and results in the most CO2 emissions [1]. Renewable energy sources are utilized in European Union in the power sector, but not as much in the building sector [2]. So, solutions that can give the building the ability to utilize grid power from renewable energy sources and at the same time generate its own eco-friendly thermal power are valuable. For the exploitation of renewable energy sources, solar technologies [3,4] and technologies like thermal energy storage and power-to-heat conversion are crucial. In this matter, dynamic models can prove to be a useful tool for the development and optimization of such systems, as they can encompass all the components of the system, operating together and provide various heat transfer properties at numerous locations of the system for further evaluation and calculations [5].
In the context of European Union “THUMBS UP” project [6], two novel thermal storage solutions are proposed: A latent heat thermal energy storage with inexpensive phase change material (PCM) from raw sources and innovative heat exchanger design. The other solution is an adsorption reactor with low cost, safe sorbent material and large thermal energy density. These two heat storages combined with photovoltaics can benefit the heating and cooling systems of a building and reduce its energy consumption. For example, on periods of surplus photovoltaic production, a heat pump can charge the heat storage, which in turn will be discharged later when there will not be any surplus.
Dynamic models using TRNSYS® software package [7] have been used to study chemical reaction thermal energy storage systems as well as PCMs systems. The simulation of a thermo-photovoltaic apparatus coupled with ground source heat pump and water storage tank was carried out by Li et al., providing energy flows, temperatures and other performance data for up to 10 years [8]. The load was the heating, cooling and electric needs of a 120 m2 building. TRNSYS analysis concluded that by applying the system, the needs are met and that the operation with heat storage is superior. Hakemzadeh et al. evaluated the technical and economic feasibility of using various solar collectors with adsorption chillers in tropical climates, modeling the system in Matlab and REFPROP [9]. Probably, the model data were linked to a TRNSYS type 909 chiller connected to a solar system's hydraulic circuit without the building. Fernandes et al. have developed a lumped model in Matlab for a Silica gel/water adsorber thermal energy storage unit [10]. This lumped model was then coupled to a TRNSYS model of a solar water heating system [11]. Using the two models, the authors concluded optimum sizes for the individual parts, i.e., the evaporator, condenser and the two tanks. They then used another commercial software GenOpt, to examine the system as a whole and find the optimum size of each part in the system in terms of energy savings [12]. Palomba et al. investigated a multi-generation system with a silica gel/water adsorption chiller for cooling telecom shelters [13]. The system, including the chiller (type 909), was modeled in TRNSYS using experimental performance maps and a time-dependent cooling load.
Camman et al. have modeled in TRNSYS a workplace building with all its facilities and control [14]. They investigated how the integration of a PCM tank for space cooling can reduce the use of non-renewable electricity. For this purpose, they tested six scenarios with different photovoltaics uses to feed the tank. The authors concluded that the integration of the storage unit is always beneficial for the utilization of photovoltaic production in the studied cases. In addition, the scenario where both the existing water tank and the PCM tank are charged simultaneously, gave the best results. Bozorgi et al. examined a solar-driven cooling system using a PCM tank, desiccant wheels and an adsorption chiller in Canada using TRNSYS [15]. A 1 m3 PCM tank stored heat for desorption during cloudy days, reducing emissions while maintaining efficiency. Abbassi et al. developed a mathematical model for a PCM thermal storage tank, later implemented in TRNSYS, which reduced building heating and cooling loads [16]. Ju et al. simulated three system setups for a house with/without PCM and different heat pumps via TRNSYS type 399 for PCM integrated in floors. Results were shown for only one week [17]. Yasin et al. investigated PCM slabs in a chilled ceiling using TRNSYS type 399, adjusting the model with an air gap to reflect real thermal behavior [18]. Validation over two summer weeks showed accurate temperatures, but deviations in cooling power. Liu et al. used TRNSYS to study a solar and air-source heat pump heating system with PCM around the water tank [19]. Components were validated individually, but not the full system; the simulation covered 4 months. Zheng and Xu investigated a transcritical CO2 heat pump with water and PCM tanks. TRNSYS types 941 and 4c were used; PCM was modeled via ε-NTU [20]. Validation showed 30% deviation in the first hour; results covered four months. Migla et al. simulated a solar-assisted cooling system using TRNSYS types 1288, 840 and 107, without a building thermal demand model (type 56) [21]. Type 840, developed by Moser et al., simulates PCM-integrated water tanks [22]. The system was tested for 10 days in July. The energy savings with the use of PCM storage coupled with air source heat pump and thermo-photovoltaics were investigated with TRNSYS by Wang et al. [23]. They found that the system can meet more than half of the energy demand and reduce the annual operating cost by 75%. A comparison between water and PCM as storage media highlighted the superiority of PCM in all key indicators except for cost.
The review of TRNSYS-based studies on the two heat storage technologies shows that only a limited number of works simulate both the building and the complete hydraulic circuit with all system components. More common is the simulation of the system itself without the building or the simulation of the system with a miniature experimental building. So, baseline platforms for later integration of advanced storage are missing in the literature. In addition, the quantification of key system variables that are essential to evaluate the technical feasibility of thermochemical or PCM storage in single family houses with air-to-water heat pump for heating and cooling and photovoltaics has not yet been systematically addressed. Finally, models that are validated for the entire year remain relatively uncommon in literature.
In this work, TRNSYS 18.05.0001 is used to investigate the feasibility of integrating thermal energy storage solutions in a single family house in Spain. The house is planned to be coupled with both latent heat and adsorption heat storage systems. The study is guided by the following objectives:
To develop a TRNSYS model of a building with an energy-efficient heat source (heat pump) and a renewable energy source (photovoltaic system) in order to provide a versatile framework for integrating heat storage, optimizing energy flows, enhancing renewable energy utilization and reducing emissions.
To assess the feasibility of thermal energy storage integration by analyzing simulation outputs such as feed temperatures to the storage devices, mass flow rates and heat pump start and stop cycles.
To provide a modeling platform that supports equipment sizing and controller development after thermal energy storage integration and to generate demand curves that facilitate optimal load shifting configurations.
To provide a modeling tool that guides the scaling-up of storage units in larger, similar buildings.
The novelties of this paper lie in the TRNSYS model developed, which integrates both building thermal behavior and the entire hydraulic circuit with all devices, controllers and auxiliary equipment. Unlike most previous studies that focus solely on the system or the building, this work achieves a comprehensive representation of real-world applications. The methodology incorporates dynamic simulations, allowing precise modeling of energy flows, thermal behavior and control strategies. By modeling energy consumption and production on a dynamic basis, the system can identify optimal times for load shifting, such as activating heat pumps during periods of high photovoltaic production or favorable ambient temperatures.
The building is a two-storey house located in Valladolid, Spain (Figure 1). Valladolid has a Mediterranean climate with hot summers and mild winters. The rainfall is moderate and the daylight lasts between 9 – 15 h per day, depending on the season. The house is rated with grade A in the energy certificate. It uses an air-to-water heat pump for heating, cooling and domestic hot water which feeds a radiant floor (through a small buffer tank) and a domestic hot water tank which is inside the heat pump’s shell. Cooling is provided with the radiant floor. On the roof, there are twelve 1.68 m2 photovoltaic panels, having maximum power output of 350 W each, which transfer their production directly to the grid.

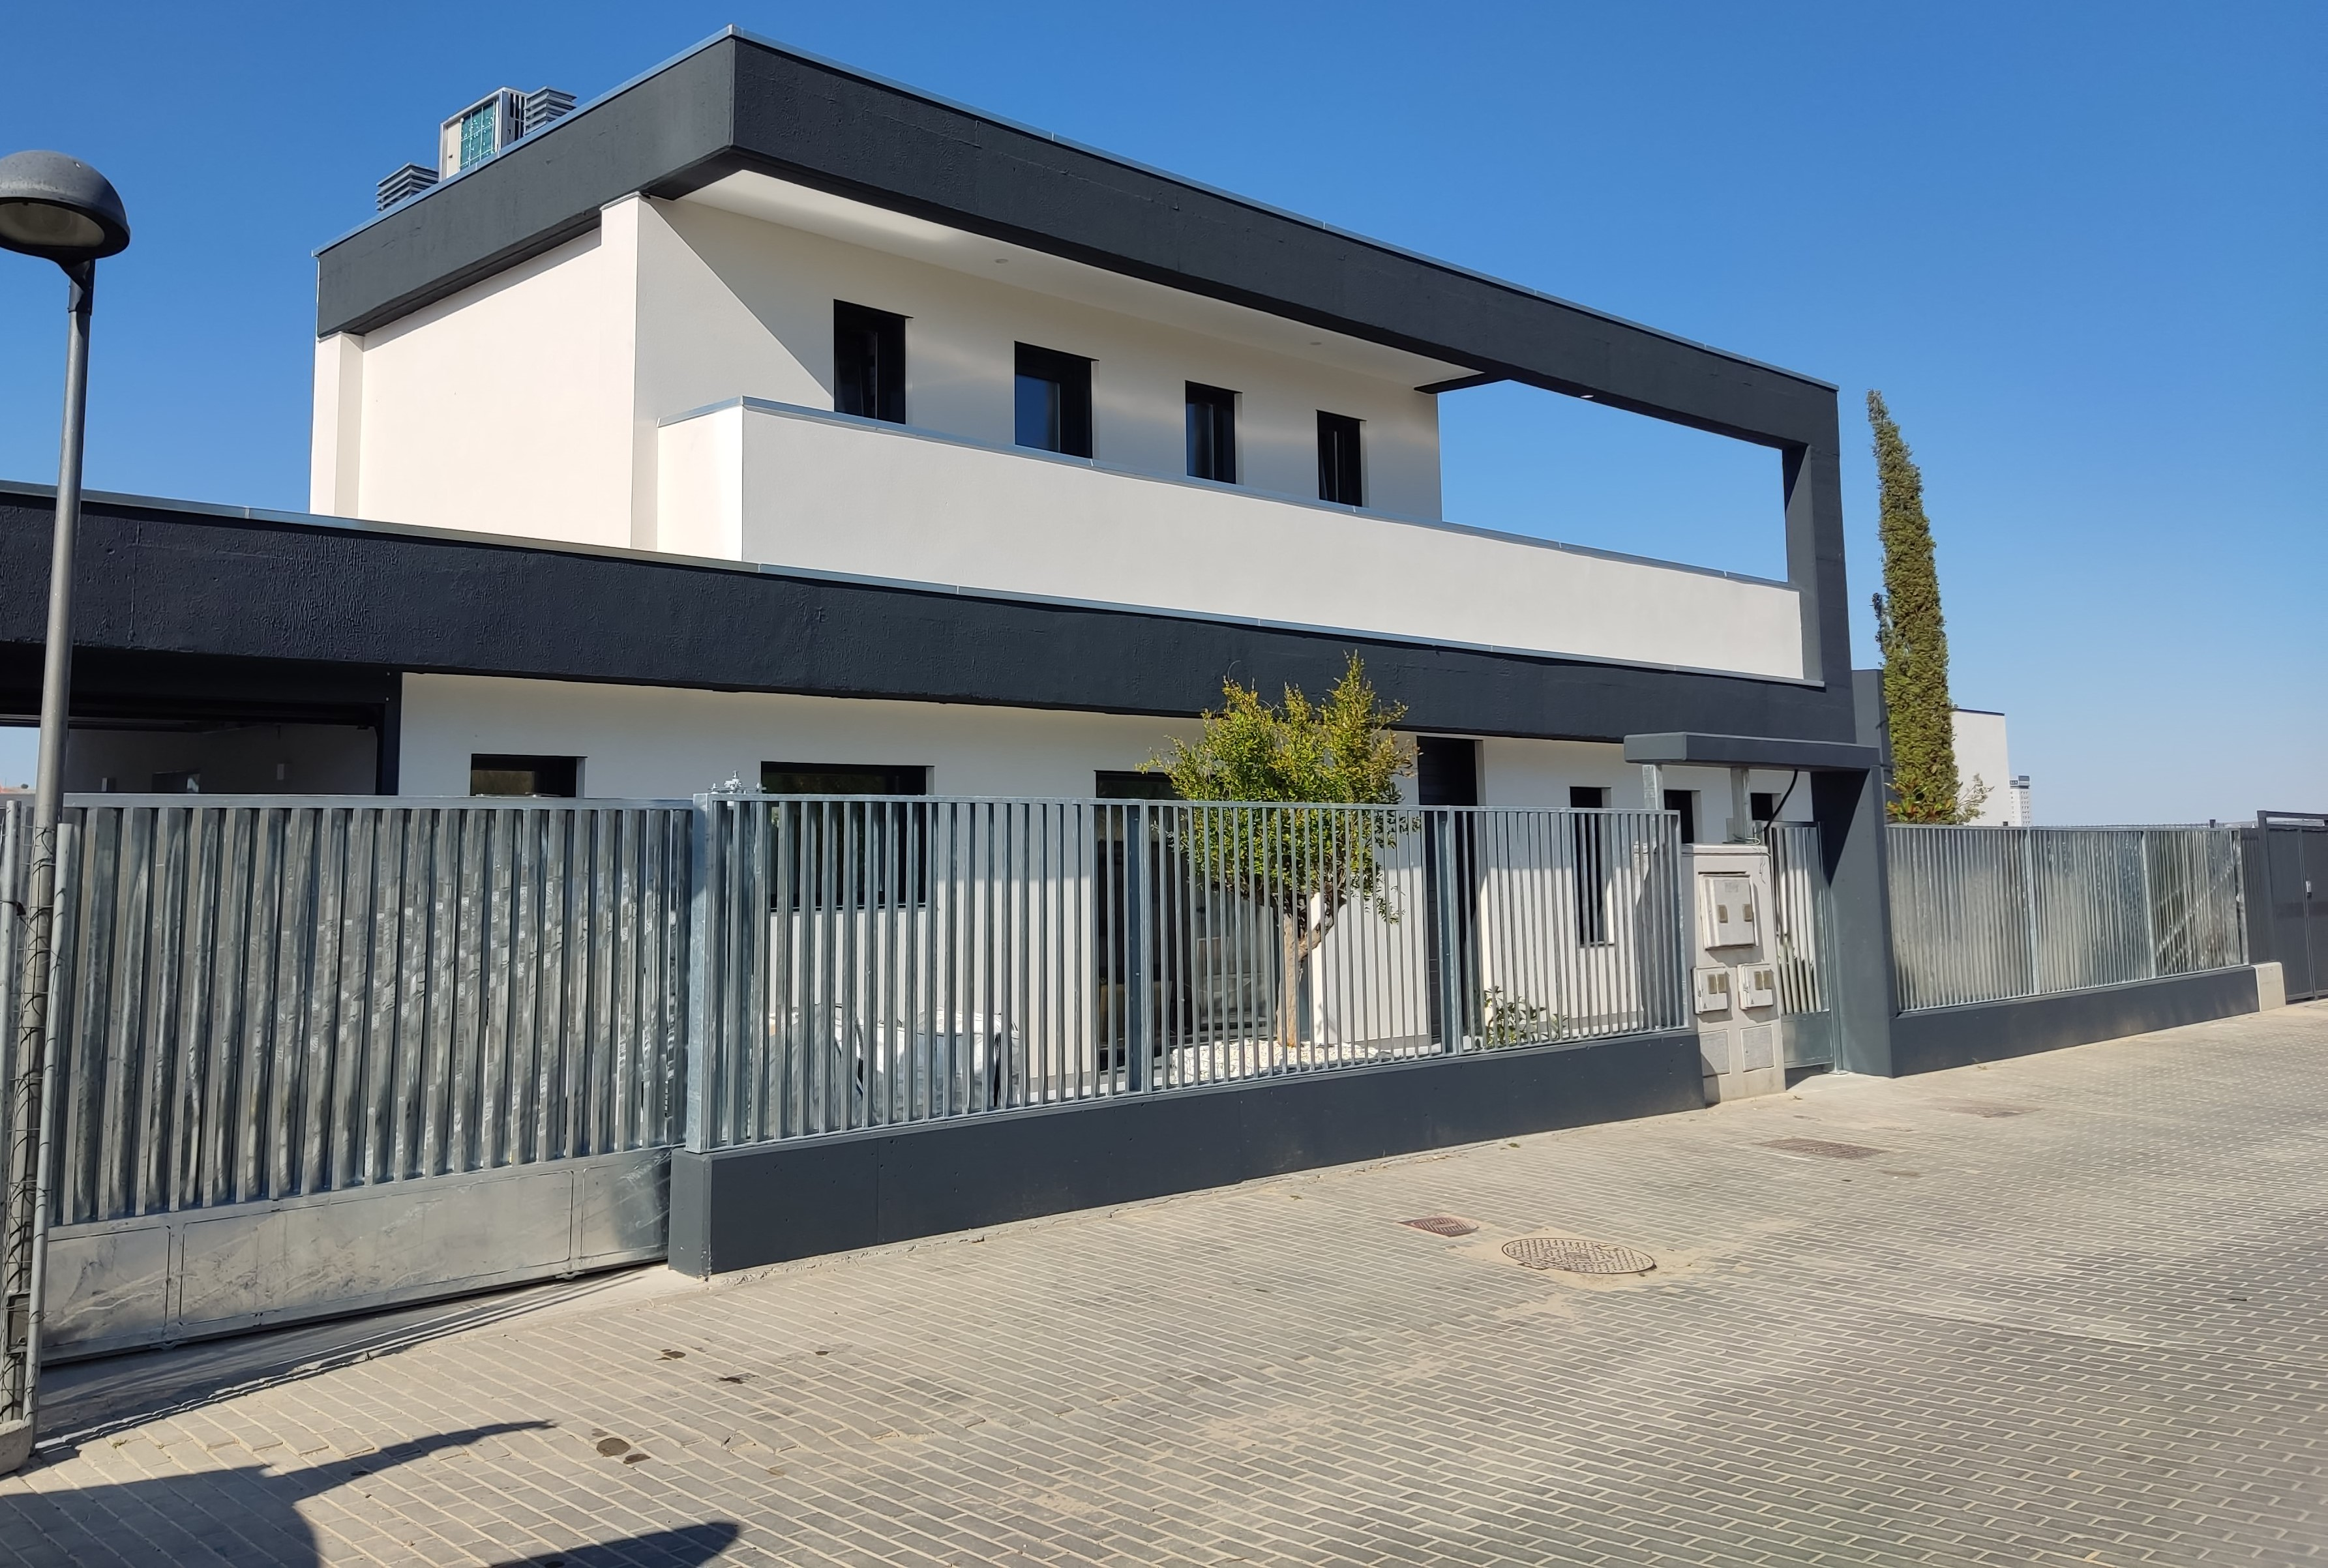
Figure 1 Photograph of the singe family house.
TRNSYS package includes TRNBuild multi-zone building software for the design of buildings, focusing on their thermal behavior only. So, the building was firstly designed in TRNBuild, then the devices, the auxiliary equipment, the controllers and the hydraulic components were synthesized in the graphical TRNSYS Simulation Studio and coupled with the building. Regarding the timestep size, a small value equal to 1 min was selected in order to accomplish high accuracy.
The building was designed in SketchUp with 3 thermal zones, each one with its own radiant floor (Figure 2). Shading from nearby structures is included in the design. The geometrical features of the building are registered in Table S1 in supplementary materials. The walls, roofs floors and windows U-values are registered in Table S2, together with the thicknesses.
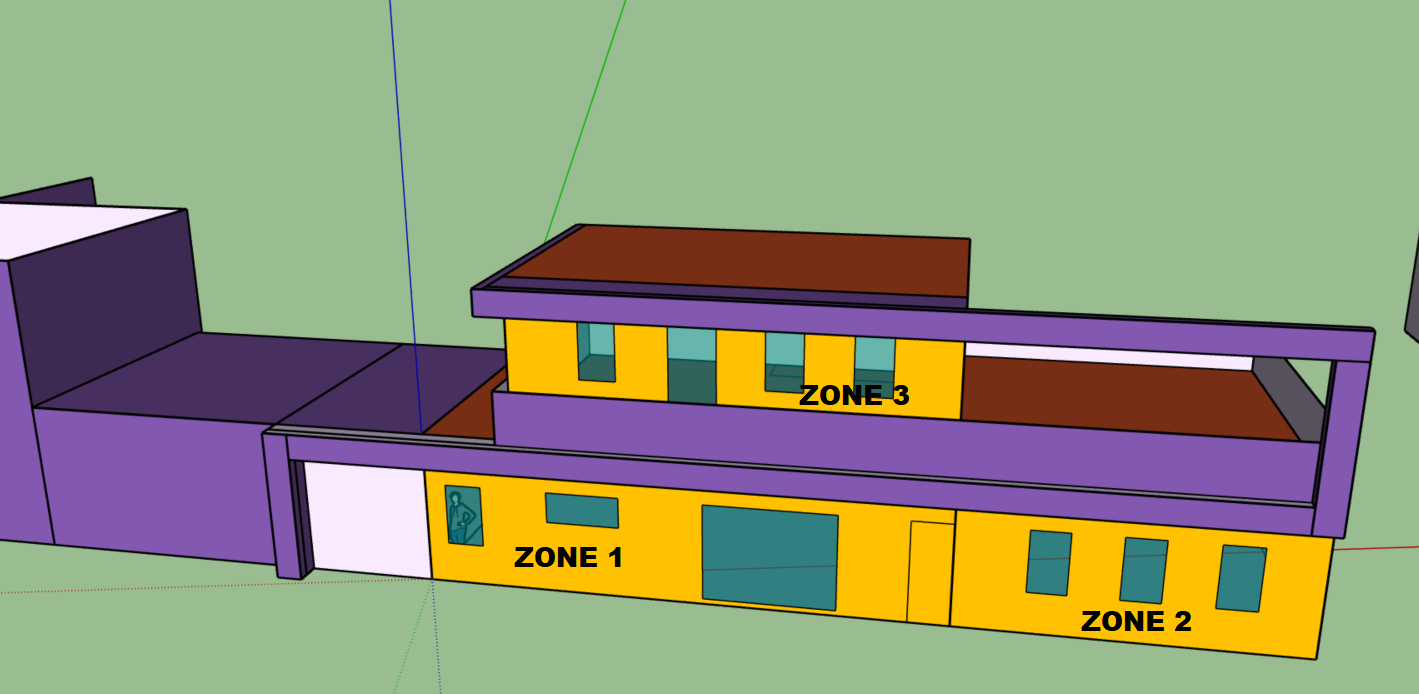
Figure 2 The house as designed in SketchUp.
The thermal part of the model was validated against an energy certificate, so typical historical weather data were needed. An EPW file was imported in the thermal part of the model [24]. EPW data are synthetically generated using Climed and include constant wind speeds of 6.7 m/s. Ground temperatures were produced with a standard soil diffusivity of 0.0023225760 m2/d. The EPW data used are for Valladolid. However, the photovoltaic production was measured on the house, so weather conditions and radiation from the building site were needed. As a result, in order to accomplish a satisfactory validation of the photovoltaic part of the model, weather measurements from the building for the year 2023 are applied in the photovoltaic part of the model.
The hydraulic circuit of the TRNSYS thermal model is illustrated in Figure 3 and consists of two parts: The space heating/cooling and the domestic hot water part. Both parts are fed by the heat pump, but not simultaneously. The air-to-water heat pump is BAXI AWHP 8MR-2 model and its characteristics are obtained from the manufacturer brochure. In particular, it has a total air flowrate of 1000 L/s, rated cooling capacity of 7.91 kW and rated heating capacity of 7.65 kW. It receives electricity directly from the public electricity supply and consumes 1.85 kW in cooling mode, 1.68 kW in heating mode and 0.1 kW for the blower. The water flow rate through the heat pump is 1320 L/h. For the simulation of the heat pump, type 941 was used with TRNSYS default performance curves, as such data were not available in the brochure. The hydraulic circuit components are:
1 type 941 air-to-water HP
1 type 154 buffer tank (50 L)
1 type 156 domestic hot water storage tank with heat exchanger coil (190 L)
Type 114 and type 110 water circulating pumps
Type 11h and type 11d flow mixers
Type 11f flow diverters
Profiles defined with types 14h for domestic hot water daily consumption
Controls defined with equations, type 106 and type 113 thermostats and type 150 “delayer”
Type 56 with radiant floor
Equations
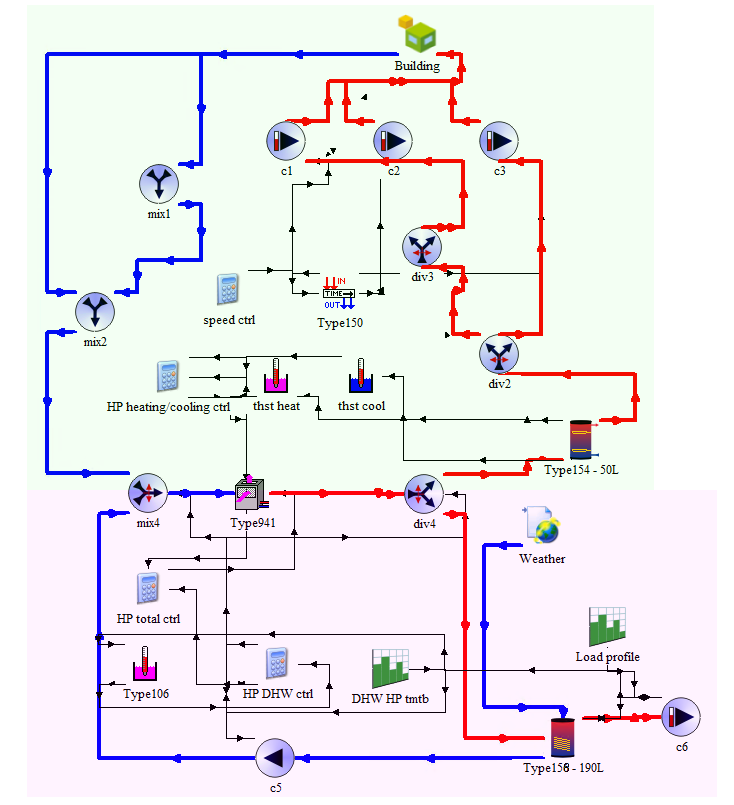
Figure 3 Main components of the space heating/cooling and domestic hot water circuit.
The thermal model also has forcing functions (type 14h) that define the heating (October to May) and cooling period (June to September). Another type 14h, defines the daily profile of ventilation. For the calculation of occupancy, lighting and equipment gains (Figure 4), types 14h and types 41a are used. The gains profile and values for windows shading are given as input to the building.
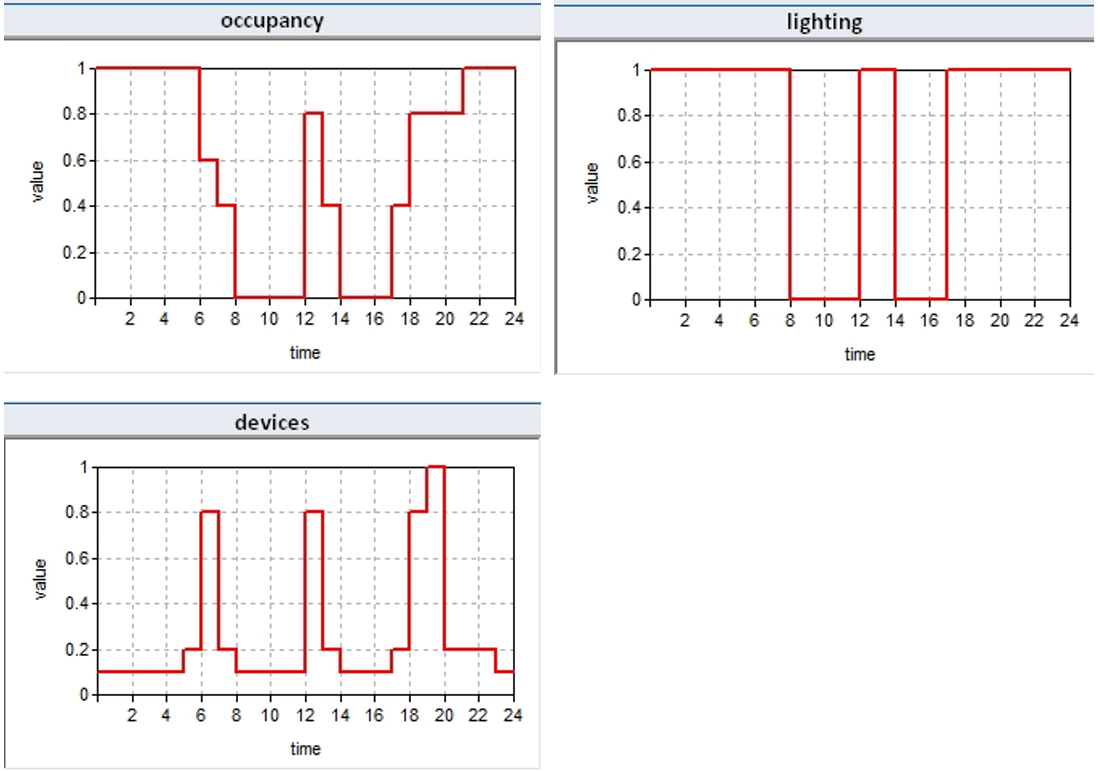
Figure 4 Occupancy, lighting and devices daily schedules.
Considering the space heating/cooling circuit, the flow begins from the heat pump that provides hot/cold water to the small buffer tank. The flow then is divided into 3 streams, each controlled by a circulating pump. Each circulating pump feeds the radiant floor of each of the 3 building’s thermal zones. After the building, the 3 streams meet again in the mixers and return to the heat pump. The heat pump turns ON and OFF according to the temperature of the buffer tank. It turns ON if the temperature is below 34 °C in winter (above 19 °C in summer) and turns OFF above 36 °C (below 17 °C in summer). On the other hand, the 3 circulating pumps (c1, c2 and c3) monitor the air temperature inside each building’s zone and turn ON if this temperature is below 27.5 °C in winter (above 18.3 °C in summer) and turn OFF at the same temperatures, as there is no dead band. However, there is a “delayer” (type 150) that holds the output-turn-ON/OFF signal for 4 minutes.
Regarding the domestic hot water circuit, it is regulated to operate with priority over the space heating/cooling circuit. According to the energy certificate of the building, the consumption is 84 L per day at 60 °C. The consumption profile is illustrated in Figure 5. The heat pump monitors the temperature of the domestic hot water at the tap. If it is below 61°C it turns ON, if it is above 63 °C it turns OFF. However, for the domestic hot water operation, there is also a signal timetable that allows only 3 heat pump activations per day; at 07:00, 11:00 and 18:00 as it can be seen in Figure 5.
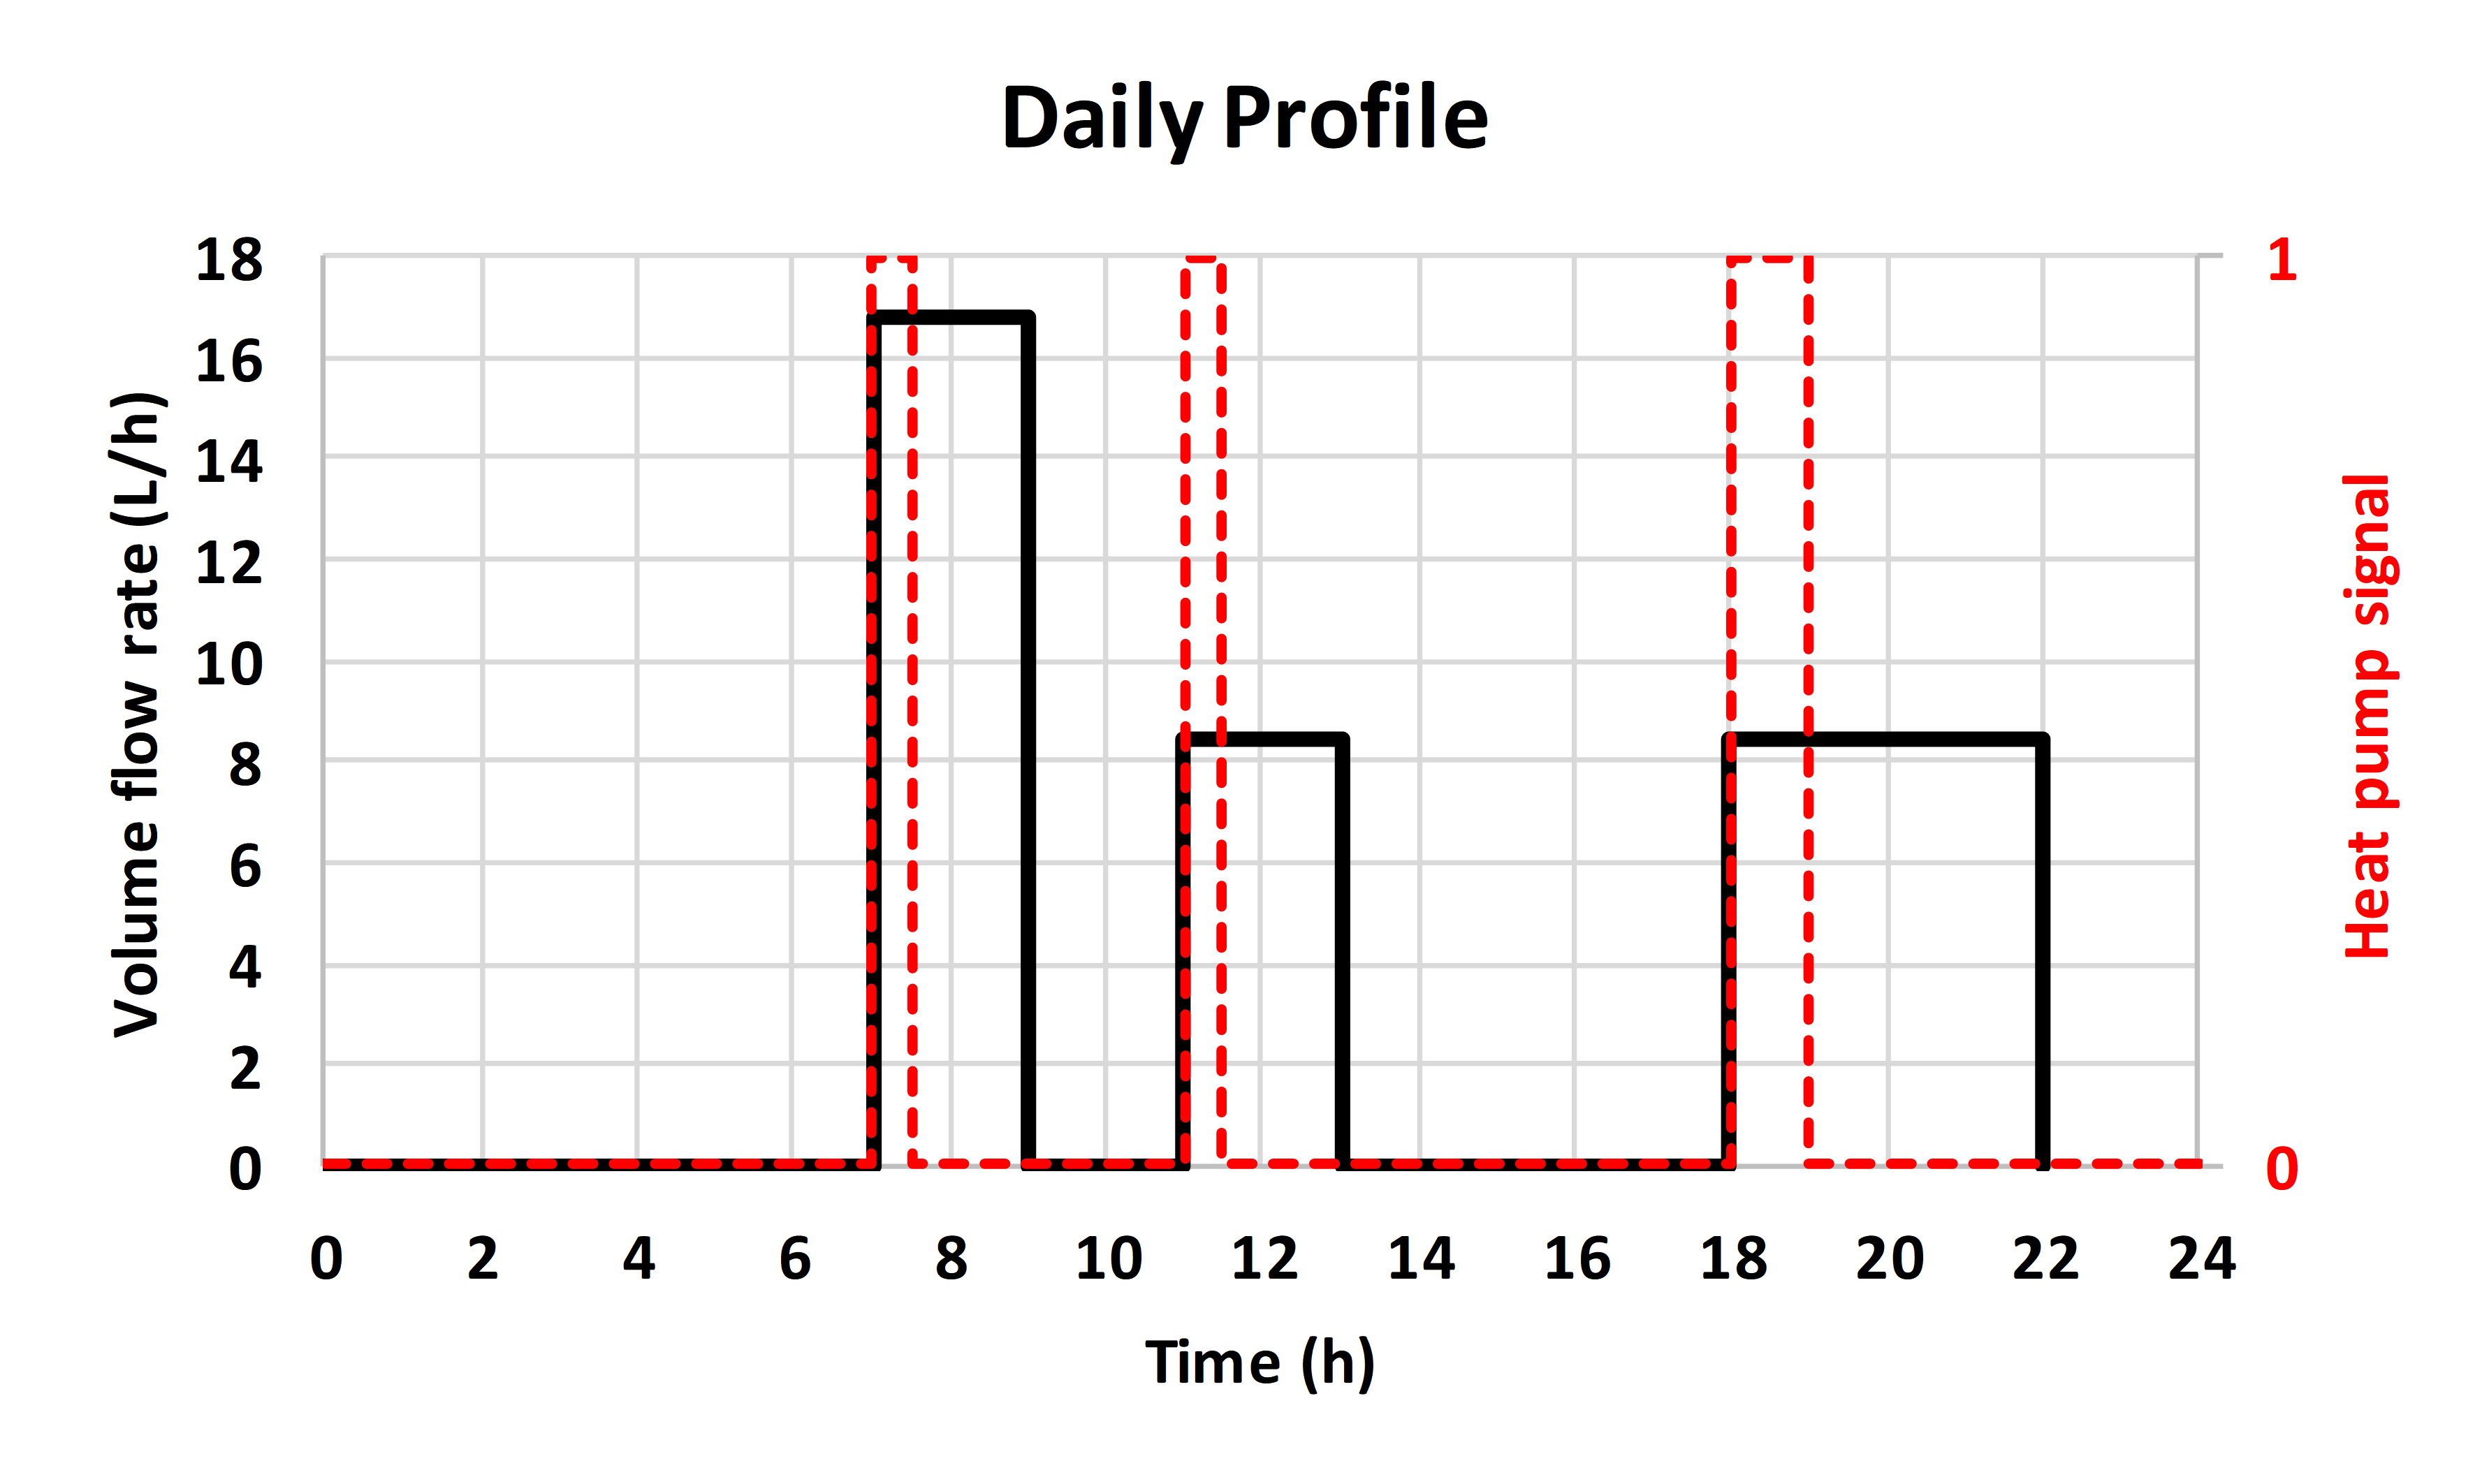
Figure 5 Domestic hot water consumption profile (black solid line-left axis) and ON/OFF heat pump signal (red dashed line-right axis).
For clarity, the main simplifications adopted in the present thermal model are summarized below:
The house is represented with three thermal zones to capture its thermal behavior and insulation characteristics.
Heat pump performance is approximated using a typical performance curve in place of the actual unit’s data.
The domestic hot water daily consumption is constant throughout the year.
Vacations periods are not considered during the year.
Standard profiles for occupancy, lighting and devices were used in place of measured profiles for the specific household.
The TRNSYS photovoltaic model is illustrated in Figure 6. It consists of measured weather input (type 9e) and solar angles input from type 15-6. Radiation data were further processed with the use of type 16k in order to match with photovoltaic, type 103b, requirements. The photovoltaic array on the roof of the house is large. For the year 2023, it produced more electricity than the one consumed by the building (heat pump, electric appliances, lights, etc.), i.e., 6512 kWh/y produced (this value includes 4% inverter loss) vs 5197 kWh/y consumed. So, it is an important renewable energy source. Photovoltaic specifications were obtained from the photovoltaic manufacturer brochure [25]. One (type 103b) photovoltaic panel was tested in TRNSYS under laboratory Standard Temperature Conditions (STC) (radiation 1000 W/m2, cell temperature 25 °C) and Nominal Operating Cell Temperature (NOCT) (radiation 800 W/m2, ambient temperature 20 °C and cell temperature 45 °C) conditions. The results of the one-panel tests are presented in Table S3 together with the manufacturer measurements for the same conditions. Apart from the cell temperature, the maximum deviation between TRNSYS results and manufacturer was 1.7% in Standard Temperature Conditions current at Maximum Power Point (MPP). So, it is validated that TRNSYS type 103b component can calculate accurately the performance of the photovoltaic panels.
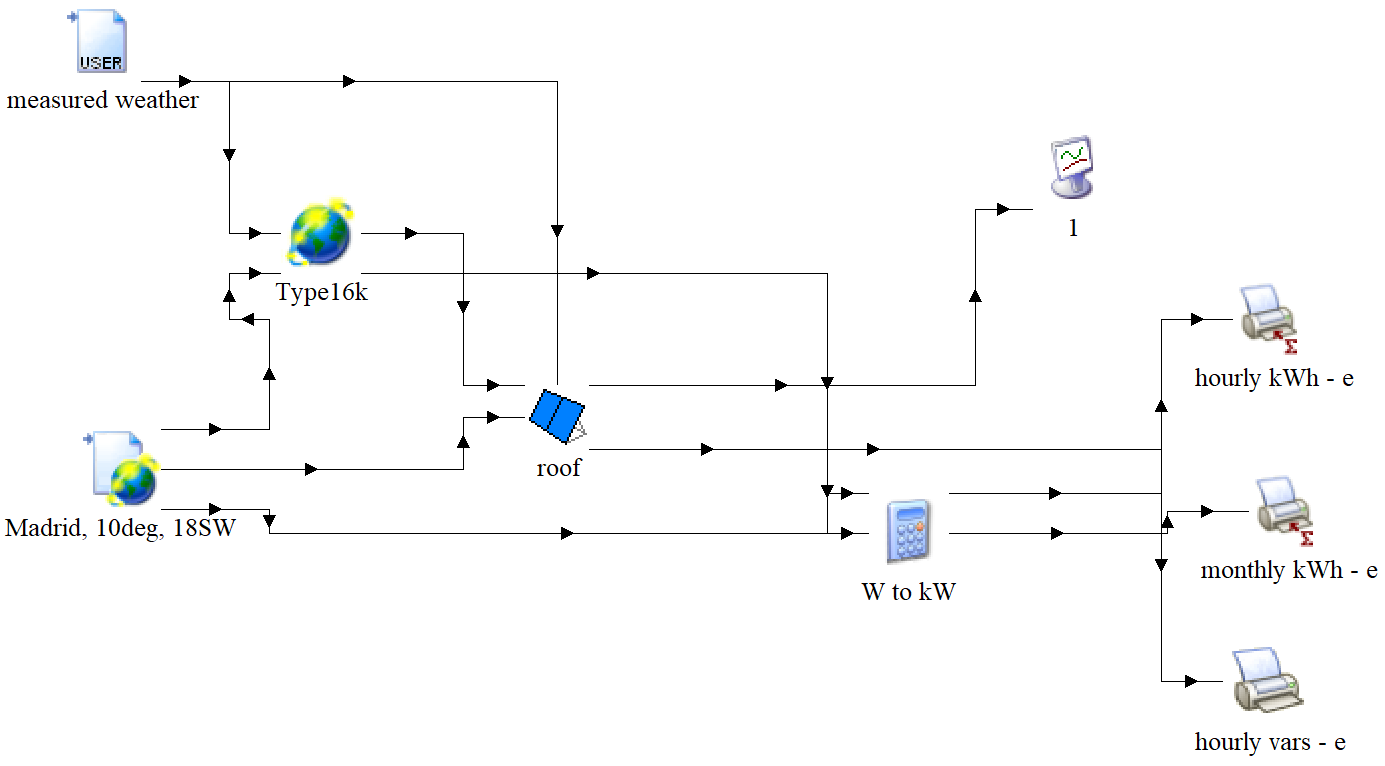
Figure 6 Photovoltaic part of the model.
The thermal demand of the building for the heating and cooling periods calculated by the energy certificate matches well with the results of the TRNSYS model as it can be seen in Table 1. The agreement between the model results and the available data from the energy certificate is satisfactory. For space heating, the TRNSYS outcome is 1618 kWh and for cooling 2358 kWh. The comparison between TRNSYS and certificate yields 0.6% difference for heating and 3.7% for cooling. The estimation of heat delivered to domestic hot water in the energy certificate is 1149 kWh and the corresponding TRNSYS value is higher, at 1671 kWh. This over-estimation of the domestic hot water thermal demand, may be attributed to the fact that TRNSYS model applies fluctuating mains temperature over the year, while the certificate probably assumes constant temperature. According to TRNSYS, during a year the heat pump has transferred 5982 kWh of heat to the heat transfer fluid and taking into account the electric energy consumed (1273 kWh), this yields a coefficient of performance equal to 4.7. In this work, a simple definition of the coefficient of performance is used, i.e., the ratio: (heat transferred by the heat pump/electricity consumed by the heat pump and the circulating pumps) during a year. Of course, not all the heat is transferred to the building or the tap, as there are losses through the tanks’ walls which sum up to 299 kWh. For the heating period, with the addition of heat storage units, the activation of the heat pump may be regulated to take place at midday to charge the units, when the ambient temperature is the highest. In this condition, the temperature lift of the heat pump (the difference between water inlet and outlet temperature) will be small, thus the heat pump efficiency will increase. For the cooling period, the heat pump may be activated during the night, also increasing its efficiency.
Table 1 Single family house energy demand.

The distribution of TRNSYS thermal demands over the 12 months of the year is given in Table 2. Space heating is practically needed from November to March, while space cooling from June to September. According to TRNSYS the coldest months were December and January of 2023, while the hottest were July and August. The domestic hot water thermal demand decreases with the increase of ambient temperature, but it in general it is stable every month.
Table 2 TRNSYS monthly thermal demands.
The zones’ air temperature, the buffer and domestic hot water tanks outlet temperature and the ambient temperature are presented in Figure 7. It can be seen that the TRNSYS zones’ air temperature do not drop below the setpoint temperature during the heating period and they do not exceed the setpoint during the cooling period. So, the system is capable of meeting the building’s space heating and cooling demands. At the same time, the radiant floor is fed with water at proper temperature, i.e., around 35 °C for heating and 18 °C for cooling. Finally, the system results to be capable of meeting the demand for domestic hot water too, as the water exiting the domestic hot water tank is maintained at approximately 60 °C throughout the year. Given the stability of the water temperature across the various components of the system, it can be concluded that it is feasible to add heat storage units that are intended to operate at a narrow temperature gap.
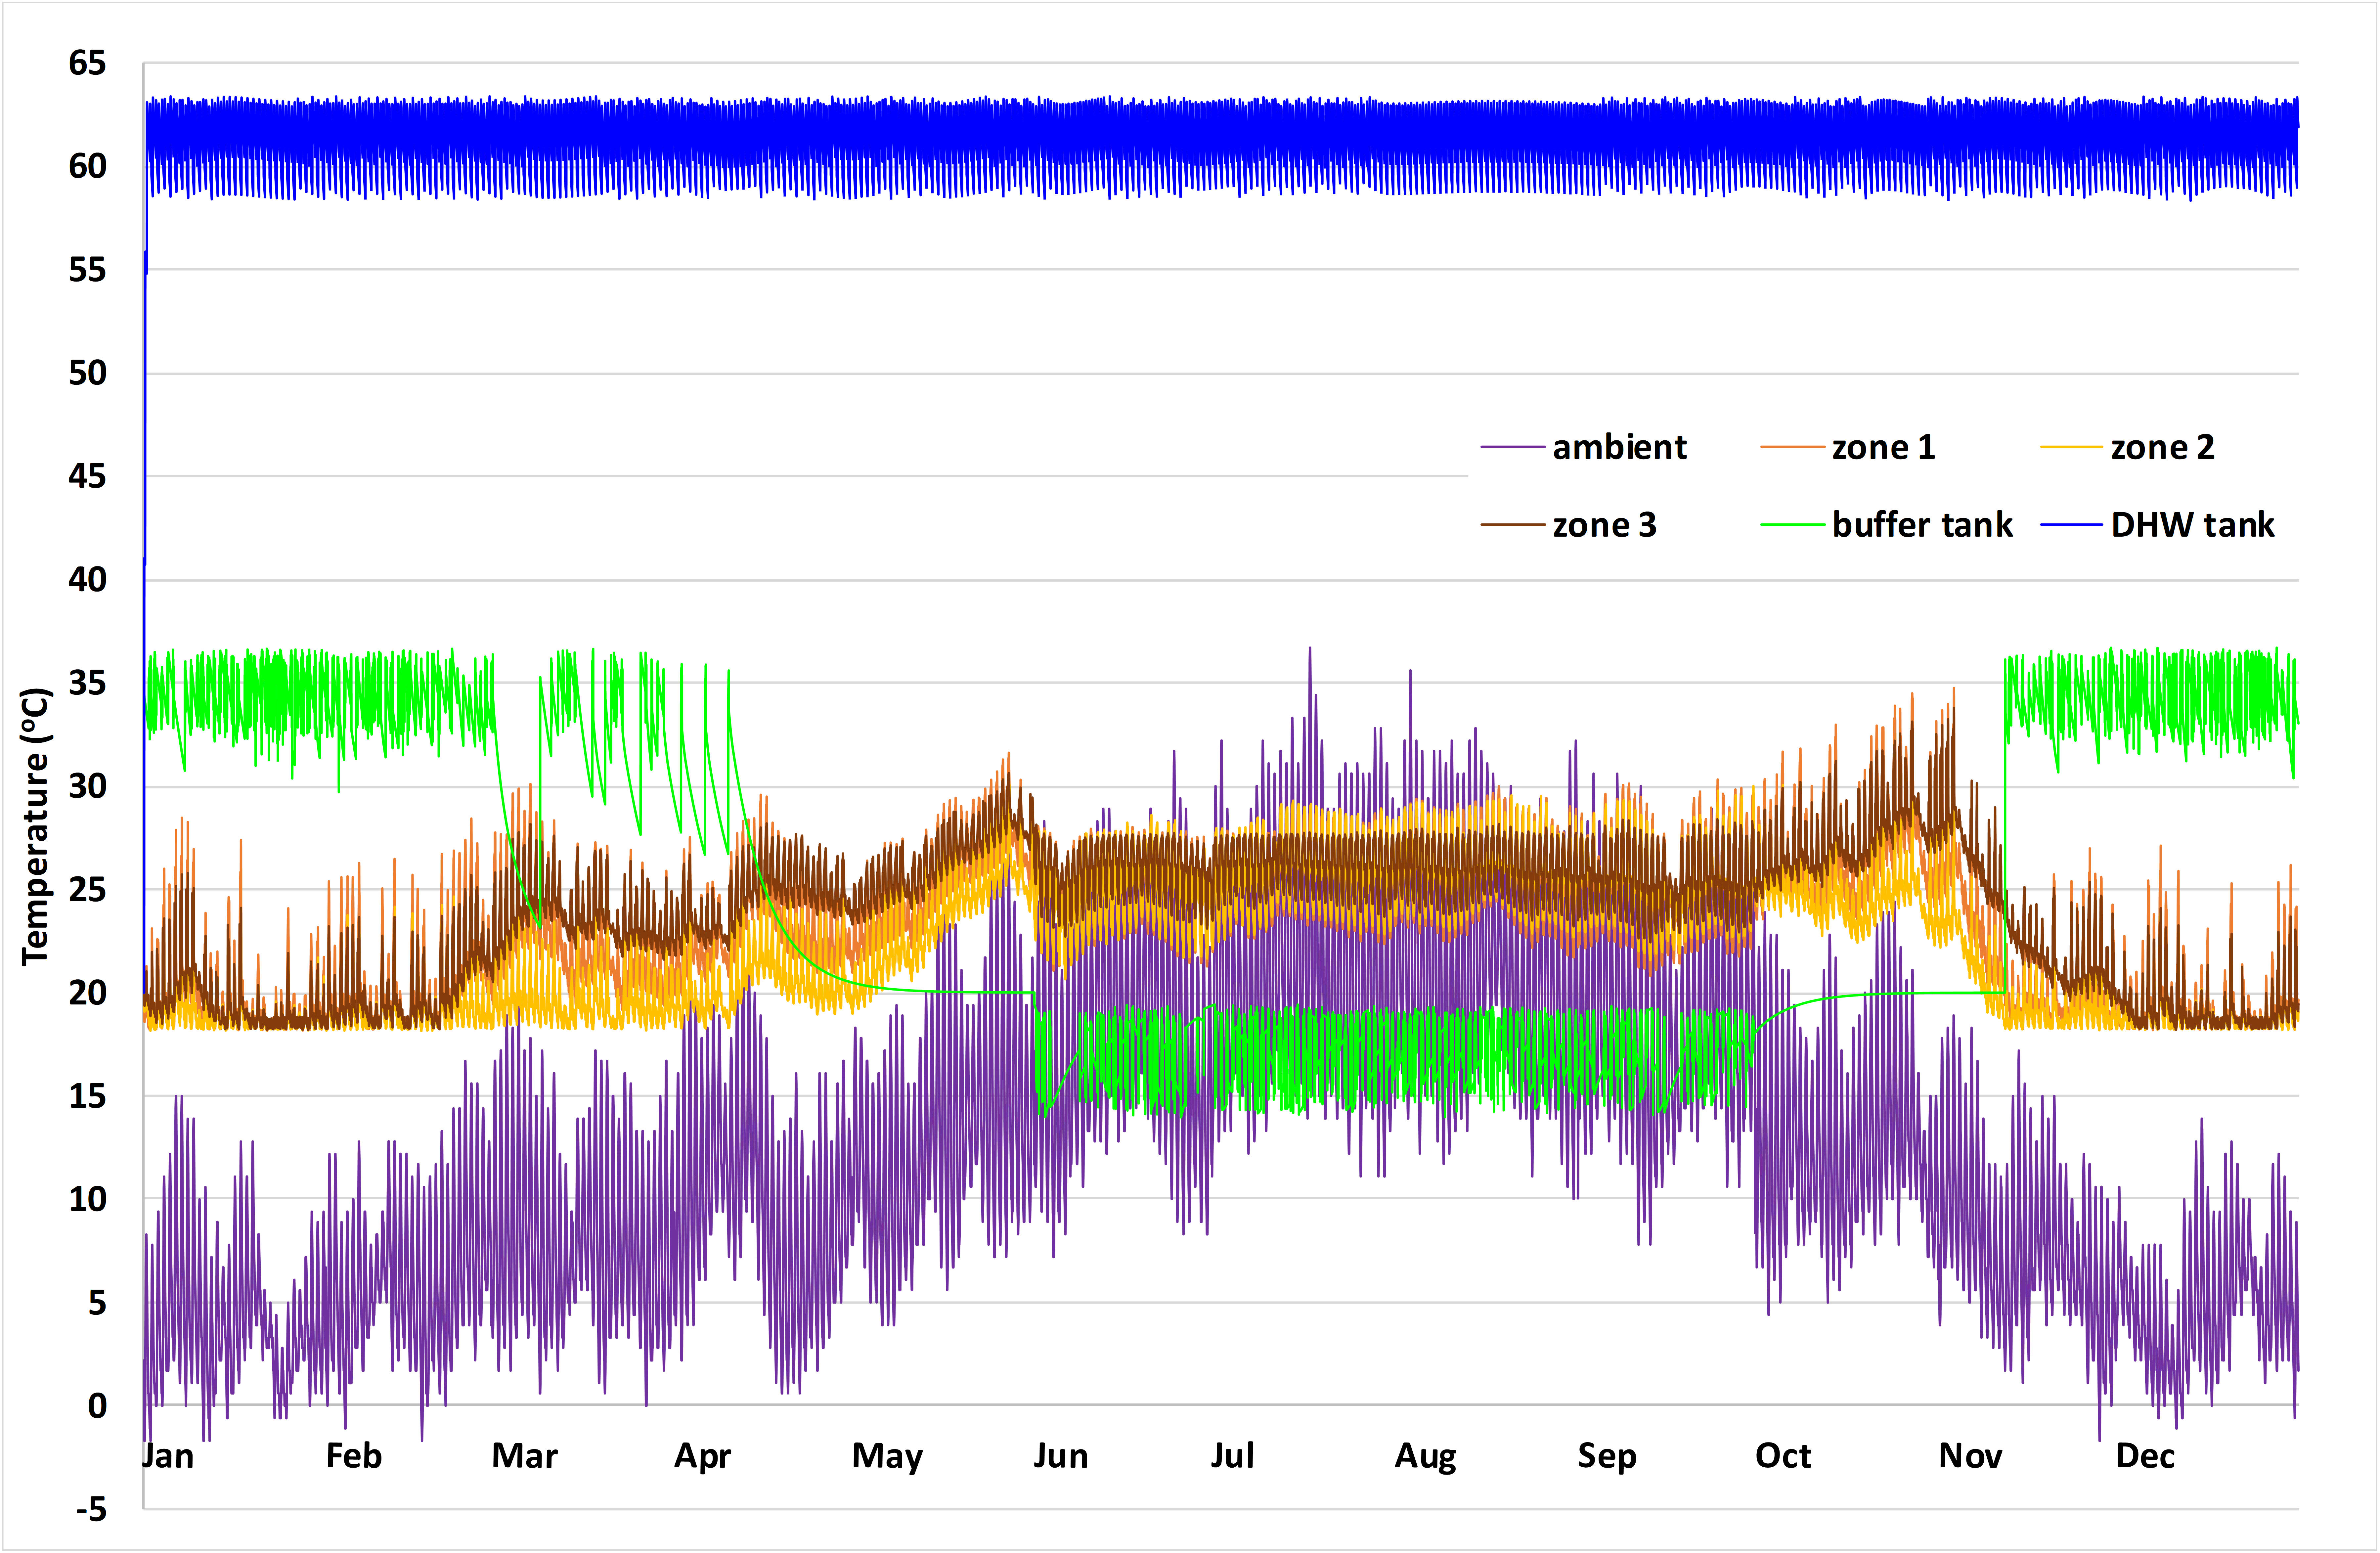
Figure 7 TRNSYS zones’, tanks’ and ambient hourly temperature.
Figure 8 illustrates the same temperature profiles as Figure 7, but for two diurnal cycles: one on a cold day in February and one on a hot day in August. At 07:00 and 18:00, the tap water temperature drops below 61 °C, triggering domestic hot water tank charging. At 11:00 however, the tank is hot enough and no boost from the heat pump is required. During the day, when the consumption of domestic hot water stops, i.e., at 09:00, 13:00 and 22:00, the rate of temperature decrease in the tank slows, which is due to heat losses through the tank shell. In February, between approximately 08:00 and 18:00 the heat pump is off and only a slight temperature decrease is observed in the buffer tank. This lower loss rate compared to the domestic hot water tank is explained by the smaller temperature difference between the buffer tank water and the surrounding room. The same effect is observed in August, where the buffer tank losses remain minimal due to the small temperature difference. Finally, except when the heat pump is active, a clear relationship emerges between the ambient temperature and the zone temperatures. In particular, solar gains between approximately 12:00 and 22:00 contribute to an increase in zone temperatures.
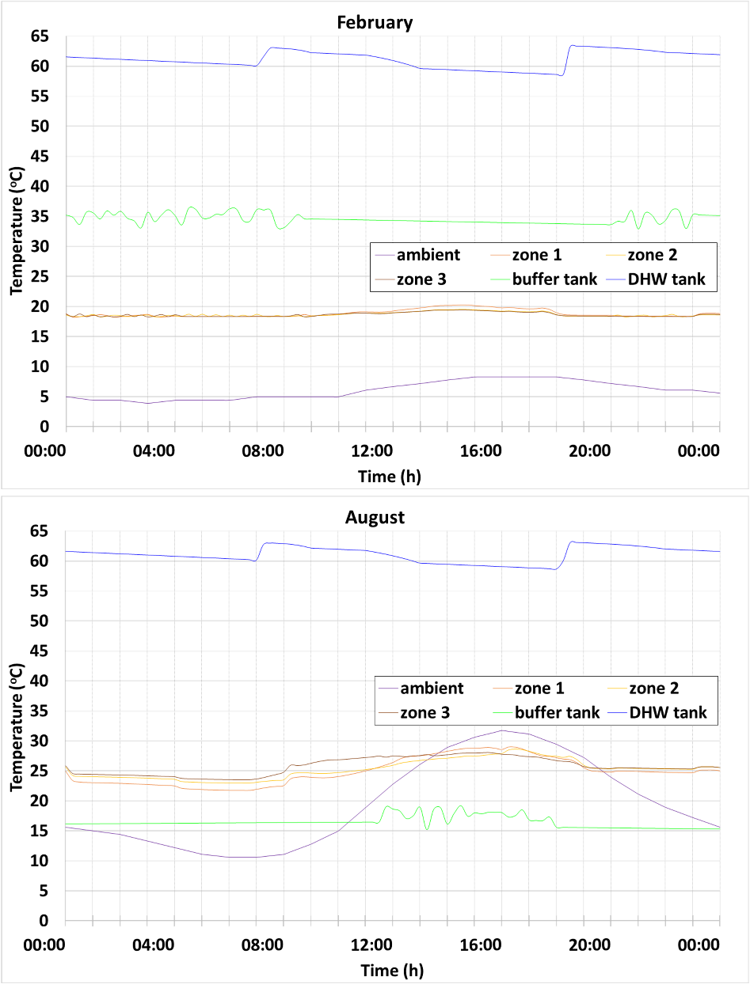
Figure 8 TRNSYS zones’, tanks’ and ambient temperature daily fluctuation for a cold and a hot month.
The validation of the TRNSYS photovoltaic system was done against measured energy from the electricity meter of the house, comparing monthly values and the results are presented in Figure 9. The difference ranges between 1–17%, with the majority of months being less than 8%. In addition, the annual measured photovoltaic produced electric energy is 6712 kWh, while TRSNYS model calculates 6512 kWh, i.e., 3.0% deviation. So, the photovoltaic part of the model is considered accurate for calculations. As expected, the electricity production presents a sinusoidal yearly distribution with minimum during winter and maximum during summer, which matches the solar radiation distribution. Heat pump yields the largest electricity consumption during the cooling period, as besides the cooling load it has to meet the domestic hot water demand due to the lack of any kind of solar water heating system. The annual TRNSYS heat pump electric consumption, including all circulating pumps, is 1273 kWh. With the addition of heat storage units, the photovoltaics will be connected to the heat pump also. The heat pump will charge the storage units at times when photovoltaic surplus energy is available or during the night, taking advantage of off-peak electricity rates. These time instances can be provided by the TRNSYS model, which can also be modified to include heat storage components.
Figure 9 TRNSYS monthly PV production vs measured values and also TRNSYS heat pump electric consumption.
The thermal demand and the photovoltaic production of a single family house in Spain were calculated using TRNSYS and the potential of heat storage units addition was discussed. The dynamic model applies a one-minute temporal resolution to simulate the house’s heat pump, water storage tanks, radiant floor and photovoltaic array and calculates the heating, cooling, domestic hot water and electricity production. The main outcomes are the following:
Examining one photovoltaic panel at laboratory conditions, TRNSYS results are in good agreement with the manufacturer values, rendering the photovoltaic part of the model valid.
The error on annual values in model’s calculation is 0.6% for space heating, 3.7% for space cooling and 3.0% for photovoltaic production. The calculated domestic hot water thermal demand was 1671 kWh and it was calculated assuming all-year house occupancy. Moreover, the controllers operate as expected, keeping the temperature of various components and the three thermal zones at the desired levels. TRNSYS thermal demands resulted to be 1618 kWh for space heating and 2358 kWh for space cooling. According to the model, the heat pump transferred 5982 kWh to the water and consumed 1273 kWh of electricity (including all circulating pumps), while the TRNSYS photovoltaic production was 6512 kWh.
The TRNSYS model calculates all the thermodynamic, heat transfer and electric values every minute. Thus, a load shift configuration due to addition of heat storage can be optimized based on these values.
According to the model, the heat pump is activated and at times when there is a large temperature lift to realize. So, if the activation is shifted (load shift) at times when the temperature lift is small (when the ambient temperature is high for heating and low for cooling), the efficiency will be high. These time instances are provided by the model.
The controllers created, provide the expected outcome, maintaining the temperatures in the tanks, the thermal zones and the taps at the desired levels.
The current model can be extended by incorporating thermal storage units with known performance, enabling a more comprehensive assessment of the system’s ability to balance supply and demand. Further work may also address demand-side management for a more realistic representation of occupant behavior, economic and environmental evaluation (life cycle analysis) and coupling with smart grids, such as electric vehicle integration.
The following supplementary materials are available on the website of this paper: GES2505040008SupplementaryMaterials.zip:
Table S1. SketchUp design dimensions.
Table S2. Wall thickness and U-value of all wall types of the buildings.
Table S3. One photovoltaic panel in laboratory conditions, TRNSYS results vs manufacturer specifications.
Not applicable.
Not applicable.
Dataset is available on request from the authors.
This project has received funding from the European Union’s Horizon Europe research and innovation programme under grant agreement No 101096921, THUMBS UP. Views and opinions expressed are however those of the authors only and do not necessarily reflect those of the European Union or CINEA.
The authors have declared that no competing interests exist.
Conceptualization: G.D. and A.T.; Methodology: G.D. and A.T.; Software: G.D., A.T. and M.P.; Validation: G.D., A.T. and O.G.; Formal Analysis: G.D. and A.T.; Investigation: G.D. and A.T.; Resources: M.P., J.M, J.G. and O.G.; Data Curation: G.D. and A.T.; Writing – Original Draft: G.D. and A.T.; Writing – Review & Editing: G.D., A.T., M.P., J.M., J.G. and O.G.; Visualization: G.D. and A.T..; Supervision: G.I.; Project Administration: G.I. and N.N.; Funding Acquisition: N.N.
| 1. | European Commission. Communications from the Commission to the European Parliament, the Council, the European Economic and Social Committee and the Committee of the Regions - An EU Strategy on Heating and Cooling [Internet]; 2016 [cited 2025 Oct 8]. Available from: https://eur-lex.europa.eu/legal-content/EN/TXT/?uri=celex:52016DC0051. |
| 2. | European Union. Renewable Energy for Heating & Cooling up to 25% in 2022 [Internet]; 2024 [cited 2024 Nov]. Available from: https://ec.europa.eu/eurostat/en/web/products-eurostat-news/w/ddn-20240227-2. |
| 3. | Korres D, Papingiotis T, Koronaki I, Tzivanidis C. Experimental analysis and optimization of a concentrated thermo-photovoltaic collector with bi-facial receiver. Renew Energy. 2024;236:121401. [Google Scholar] [CrossRef] |
| 4. | Korres D, Papingiotis T, Koronaki I, Tzivanidis C. Thermal and optical analyses of a hybrid solar photovoltaic/thermal (PV/T) collector with asymmetric reflector: numerical modeling and validation with experimental results. Sustainability. 2023;15(13):9932. [Google Scholar] [CrossRef] |
| 5. | Dogkas G, Tsimpoukis A, Itskos G, del Castillo JC, Lozano I, Gustafsson O, Nikolopoulos N. Analysis of a hybrid heating system with TRNSYS: district heating, heat pumps and photovoltaics in a multi-apartment building. Energy Build. 2025;344. [Google Scholar] [CrossRef] |
| 6. | THUMBS UP [Internet]. RISE Research Institutes of Sweden. [cited 2024 Nov]. Available from: https://www.thumbsupstorage.eu/. |
| 7. | Klein S. TRNSYS 18: A Transient System Simulation Program. Madison: Solar Energy Laboratory, University of Wisconsin; 2017. [Google Scholar] |
| 8. | Li T, Wan X, Li G, Liu Y, Liu Q, Gong Y, Shi L, Hu Z, Mao Q. Thermal performance and energy flow analysis of a PV/T coupled ground source heat pump system. Appl Therm Eng. 2024;240:122265. [Google Scholar] [CrossRef] |
| 9. | Hakemzadeh M, Sopian K, Kazem H, Al-Waeli A, Chaichan M. Evaluating the techno-economic viability of different solar collectors integrated into an adsorption cooling system in tropical climate conditions. Sol Energy. 2024;268:112304. [Google Scholar] [CrossRef] |
| 10. | Fernandes M, Brites G, Costa J, Gaspar A, Costa V. Modeling and parametric analysis of an adsorber unit for thermal energy storage. Energy. 2016;102:83-94. [Google Scholar] [CrossRef] |
| 11. | Fernandes M, Brites G, Costa J, Gaspar A, Costa V. A thermal energy storage system provided with an adsorption module - dynamic modeling and viability study. Energy Convers Manag. 2016;126:548-560. [Google Scholar] [CrossRef] |
| 12. | Fernandes M, Gaspar A, Costa V, Costa J, Brites G. Optimization of a thermal energy storage system provided with an adsorption module - A GenOpt application in a TRNSYS/MATLAB model. Energy Convers Manag. 2018;162:90-97. [Google Scholar] [CrossRef] |
| 13. | Palomba V, Ferraro M, Frazzica A, Vasta S, Sergi F, Antonucci V. Dynamic Simulation of a Multi-Generation System, for Electric and Cooling Energy Provision, Employing a SOFC Cogenerator and an Adsorption Chiller. Proceedings of the World Engineers Summit - Applied Energy Symposium & Forum: Low Carbon Cities & Urban Energy Joint Conference; 2017 July 19-21; Singapore. |
| 14. | Camman MP, Chicote MA, Nieto LB, Gabarre IL, Munoz JS, Garcia JDC. Modelling and Simulation of a Thermal Storage System Based on Phase Change Materials Integrated in a Tertiary Building. Proceedings of the 2nd Int Conf SUstainable PolyEnergy generation and HaRvesting – SUPEHR23; 2023 September 6-8; Italy. |
| 15. | Bozorgi M, Tasnim S, Mahmud S. Enhancing Indoor Thermal Comfort and Sustainability: A Solar-Driven Desiccant Cooling and Adsorption Chiller System with Environmental Impact Assessment. Sol Energy. 2024;271:112440. [Google Scholar] [CrossRef] |
| 16. | Abbassi Y, Baniasadi E, Ahmadikia H. Transient Energy Storage in Phase Change Materials, Development and Simulation of a New TRNSYS Component. J Build Eng. 2022;50:104188. [Google Scholar] [CrossRef] |
| 17. | Ju H, Li X, Chang C, Zhou W, Wang G, Tong C. Heating Performance of PCM Radiant Floor Coupled with Horizontal Ground Source Heat Pump for Single-Family House in Cold Zones. Renew Energy. 2024;235:121306. [Google Scholar] [CrossRef] |
| 18. | Yasin M, Scheidemantel E, Klinker F, Weinlader H, Weismann S. Generation of a Simulation Model for Chilled PCM Ceilings in TRNSYS and Validation with Real Scale Building Data. J Build Eng. 2019;22:372-382. [Google Scholar] [CrossRef] |
| 19. | Liu P, Zhao J, Chen J. Simulation Study of a Novel Solar Air-Source Heat Pump Heating System Based on Phase-Change Heat Storage. Sustainability. 2023;15:15684. [Google Scholar] [CrossRef] |
| 20. | Zheng Y, Xu T. Effects of the Different Water Tank Location on the Performance of CO2 Heat Pump with Thermal Energy Storage for Space Heating. J Mech Sci Technol. 2024;38:3185-3195. [Google Scholar] [CrossRef] |
| 21. | Migla L, Bogdanovics R, Lebedeva K. Performance Improvement of a Solar-Assisted Absorption Cooling System Integrated with Latent Heat Thermal Energy Storage. Energies. 2023;16:5307. [Google Scholar] [CrossRef] |
| 22. | Moser C, Heinz A, Schranzhofer H. TRNSYS Type 840: Simulation Model for PCM/Water Storage Tanks. Version 2.0 [software]. Gratz University of Technology; 2022 [cited 2025 Oct 8]. Available from: https://repository.tugraz.at/records/mg0ve-jqr68. |
| 23. | Wang X, Li T, Yu Y, Liu X, Liu Y, Wang S, Li G, Mao Q. Energy saving and economic analysis of a novel PV/T coupled multi-source heat pump heating system with phase change storage: A case study in cold zone in China. Energy Conv Manag. 2024;312:118574. [Google Scholar] [CrossRef] |
| 24. | Lawrie L, Crawley D. Development of Global Typical Meteorological Years (TMYx) [Internet]; 2022 [cited 2025 Oct 8]. Available from: https://climate.onebuilding.org/. |
| 25. | JA Solar [Internet]. 350W MBB Half-Cell Module JAM60S10 330-350/MR Series. [cited 2025 Oct 8]. Available from: https://www.stadtwerke-luenen.de/fileadmin/user_upload/Technisches_Datenblatt_Solarmodul_Aufstaenderung_345_Watt.pdf. |

![]()
Copyright © 2026 Pivot Science Publications Corp. - unless otherwise stated | Terms and Conditions | Privacy Policy


