
Green Energy and Sustainability ISSN 2771-1641
Green Energy and Sustainability 2025;5(3):0007 | https://doi.org/10.47248/ges2505030007
Review Open Access
The importance of porosity and state of saturation for the thermal properties of rocks and sediments
David Banks

Academic Editor(s): Tony Roskilly
Received: May 21, 2025 | Accepted: Aug 27, 2025 | Published: Sep 11, 2025
© 2025 by the author(s). This is an Open Access article distributed under the terms of the Creative Commons License Attribution 4.0 International (CC BY 4.0), which permits unrestricted use, distribution, and reproduction in any medium or format, provided the original work is correctly credited.
Cite this article: Banks D. The importance of porosity and state of saturation for the thermal properties of rocks and sediments. Green Energy Sustain 2025; 5(3):0007. https://doi.org/10.47248/ges2505030007
Rocks and sediments are composite materials comprising multiple mineral (or other solid) phases, with fluid phases (air, water, hydrocarbons) or ice filling the pore spaces. Two key thermogeological parameters, used in the design of ground source heating and cooling (GSHC) and geothermal systems are (i) volumetric heat capacity (a scalar quantity) and (ii) thermal conductivity (a tensor). The bulk volumetric heat capacity of a composite material, being a scalar quantity, can simply be calculated as the weighted arithmetic mean of the components. Many proposals have been made for the estimation of bulk thermal conductivity from the conductivities of a rock or sediment’s components, and no single proposal is universally satisfactory. A variety of proposed algorithms have been examined for monomineralic systems (quartz or calcite + water + air). A weighted geometric mean of the components of a geological material generally provides a good (but not perfect) estimator of bulk thermal conductivity, but tends to perform poorly in dry, porous materials. A semi-empirical “Kersten-Johansen” approach seems a good estimator of thermal conductivity of porous sandy materials at varying states of compaction and saturation; its applicability to lithified rocks and non-silicate lithologies has yet to be demonstrated.
Keywordsthermal conductivity, volumetric heat capacity, composite materials, porosity, moisture content
An evaluation of the thermal properties of rocks and sediments—especially thermal conductivity (λ) and volumetric heat capacity (cVHC; the product of density ρ and specific heat capacity c) is central to the design of ground source heat pump schemes, geothermal developments and other geotechnical engineering projects [1]. Rocks and sediments are, however, composite materials, with individual textures and grain-size characteristics, with varying proportions of multiple mineral phases and at least one fluid phase (air and water being the most common, but potentially also hydrocarbons or ice).
Lookup tables of typical thermal properties of various geological materials can be found in many textbooks, reports and design manuals [2–9]. Several of these databases derive from each other and, in some cases, the original sources of the measurements are unclear. While some databases of unconsolidated sediments cite values for “dry”, “moist” and “saturated” sediments [6], it is unclear exactly what these terms mean. For lithified rocks, the porosity of the rock and the state of saturation under which the original measurements were undertaken are not always clearly specified [10,11]. A notable exception is the database of Irish rocks [12] where porosities and dry and water-saturated thermal conductivities and densities are clearly documented.
The impact of porosity, density and state of saturation on thermal properties of rocks and sediments has been examined in detail by a number of authors: the comprehensive experimental studies by Miles Kersten [13,14] and the more theoretical considerations of Omar Farouki [15] and Øystein Johansen [16,17] are regarded as key pieces of literature. It is not the purpose of this paper to supersede these previous studies, merely to recapitulate, condense and summarize key considerations for a new generation of geothermal and ground source heat practitioners.
This review paper will argue that an understanding of the porosity and state of saturation can be very important, both when determining thermal properties in a laboratory and when citing them in literature and using them for purposes of thermogeological design. To emphasize the point, consider the large difference in thermal properties between the following types of “sandstone”: (a) a highly consolidated, low-porosity metasandstone such as a psammite, (b) a water-saturated, highly porous, poorly consolidated sandstone and (c) a completely dry, highly porous, poorly consolidated sandstone.
Reliable and accurate laboratory determinations of moisture content, state of saturation and porosity of geological materials are not trivial. There are also considerable challenges in preserving the in-situ porosity and moisture content during sampling (i.e., drilling and extraction of core from a borehole). This paper will not, however, review methodologies and challenges in sampling and measuring these parameters, but will take them as starting points for estimating thermal parameters.
At the outset, it is acknowledged that both heat capacity and thermal conductivity will have some dependence on temperature and pressure, and the impacts of these are widely discussed in the literature [18,19]. In this paper, we will consciously restrict the discussion of these thermal properties to the relatively shallow subsurface or laboratory conditions (i.e., pressure close to 100 kPa and 0–30 °C).
A geological material’s volumetric heat capacity (cVHC in J/m3/K) can be defined as the product of density (ρ; kg/m3) and specific heat capacity (c; J/kg/K):
It is a scalar quantity and can be calculated simply as the weighted arithmetic mean of all the components comprising the bulk rock or sediment [20]:
where
cVHC is the bulk volumetric heat capacity of the rock or sediment (the product of bulk density and bulk specific heat capacity),
cVHC,m1 is the volumetric heat capacity of the first mineral phase in the rock,
∅v,m1 is the volumetric fraction of the first mineral phase in the bulk rock volume,
cVHC,f1 is the volumetric heat capacity of the first fluid phase in the rock’s pore space,
∅v,f1 is the volumetric fraction of the first fluid phase in the bulk rock volume (and where the sum of all volumetric fractions is equal to 1).
In a fully water-saturated sandstone, (or limestone), where quartz (or calcite) is the sole mineral phase, then this reduces to:
or for a completely dry rock
where
n = porosity,
cVHC,m is the volumetric heat capacity of the mineral comprising the matrix (quartz or calcite). This refers to the pure mineral in its non-porous form,
cVHC,w is the volumetric heat capacity of water (which is slightly salinity- and temperature-dependent),
cVHC,a is the volumetric heat capacity of air.
Figure 1 illustrates the impact of porosity and state of saturation on the volumetric heat capacity of a quartz sandstone at 10–20 °C, by setting the volumetric heat capacity of quartz to 1.96 MJ/m3/K [4], that of water to 4.19 MJ/m3/K [21] and that of air to 1.25 kJ/m3/K [22,23]. The last is the product of the isobaric specific heat of air and its density at 10 °C; whether the isobaric or isochoric heat capacity is most appropriate will depend on the state of “openness” of the pore spaces in the rock or sediment, but the heat capacity of air is so low that it makes negligible difference to the outcome of these calculations.

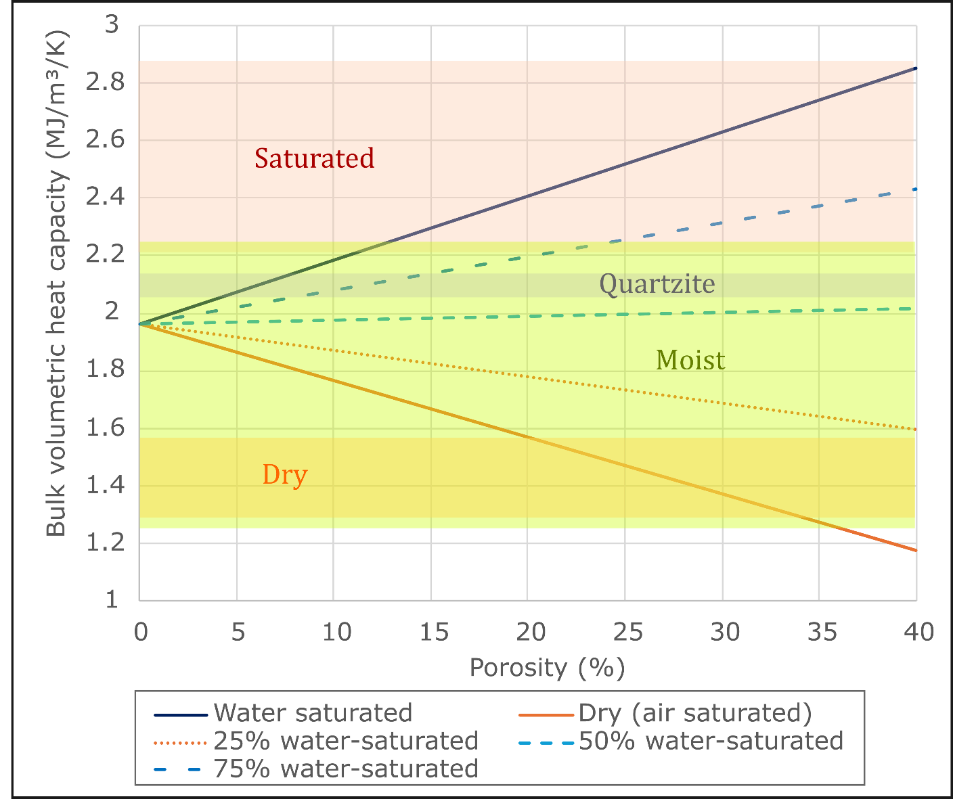
Figure 1 Calculated values of bulk volumetric heat capacity for a pure quartz sand/sandstone, as a function of porosity and water saturation (% by volume). The coloured fields show the range of values recommended for dry, moist and saturated sand, and quartzite in the database of Blomberg et al. [6].
Figure 2 illustrates the impact of porosity and state of saturation on the volumetric heat capacity of a calcitic limestone at 10–20 °C, by setting the volumetric heat capacity of calcite to 2.14 MJ/m3/K [4].
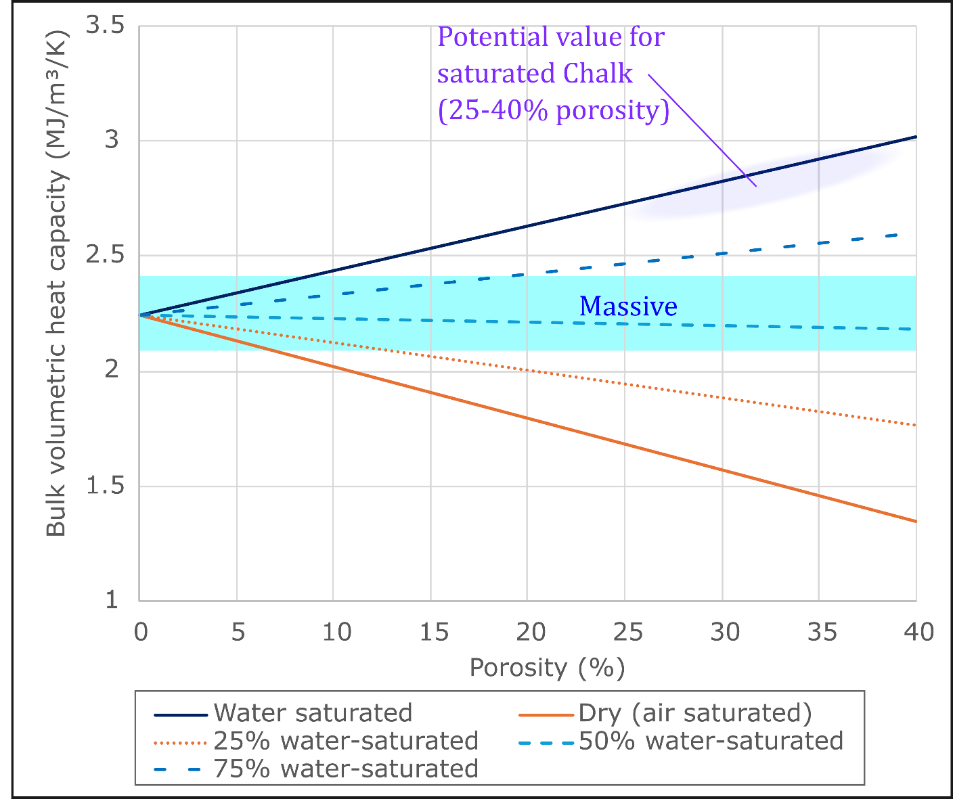
Figure 2 Calculated values of bulk volumetric heat capacity for a pure calcite limestone, as a function of porosity and water saturation (% by volume). The pale blue field show the range of values recommended for massive limestone in the database of Blomberg et al. [6].
To derive Figures 1 and 2, equation (2) has simply been programmed into an Excel spreadsheet and the input parameters systematically varied.
Thermal conductivity is a tensor, rather than a scalar, property and its value is usually anisotropic. This can be the case when considering individual thermally anisotropic crystals: for example, the thermal conductivity of quartz and calcite crystals is considerably greater in the direction parallel to the crystal axis than perpendicular to it. The thermal conductivity of whole rocks can also be anisotropic: this can be due to preferential orientation of anisotropic crystals within the rock, or it can be due to sedimentological layering or metamorphic foliation at the micro-, meso- or macro-scale. For a layered sequence, bulk thermal conductivity parallel to the direction of layering is given by the thickness-weighted arithmetic mean of the various layers; in the direction perpendicular to layering, it is given by the weighted harmonic mean [19,20].
For a sample of rock comprising mineral grains and fluid filled pore spaces, it can be readily understood that there will not be a single formula that gives a bulk thermal conductivity. Bulk thermal conductivity will depend on mineral thermal conductivity, porosity, fluid thermal conductivity and state of saturation, but it will also depend on the texture of the rock, the size and relative connectivity of the various components and also to any boundary effects (e.g., additional resistances at grain boundaries due to weathering or alteration).
Moreover, several non-intuitive composite thermal conductivity effects are noted in the literature. Albert et al. [24] noted that the thermal conductivity of some mudstones and marlstones may be lower in water saturated condition than when dry, due to dissolution of clay minerals in water. Woodside and Messmer [25] note that porous materials will have a much higher bulk composite thermal conductivity when saturated with a liquid, compared with the case when saturated with a gas of similar conductivity—a possible thermal analogue of the Klinkenberg permeability effect [26]. Woodside and Messmer [25] note the potential for condensation of moisture from air in pore spaces to disturb the measurement of dry bulk conductivity.
The methods of estimating “bulk” thermal conductivity discussed below are only a selection of the simpler methods among a large number that have been proposed for composite materials. Woodside & Messmer [20] document several of these alternative methods for fluid-saturated composite materials. The methods described below have been selected because they can be applied to composite materials at various degrees of saturation.
One common model used as a starting point for estimating bulk thermal conductivity is simply the weighted geometric mean of thermal conductivities of the various solid and fluid components [3,19,27]
where
λm1 is the thermal conductivity of the first mineral phase in the rock. This refers to the pure mineral in its non-porous form,
λf1 is the thermal conductivity of the first fluid phase in the rock’s pore space.
The geometric mean was advocated by Sass et al. [28], who also noted that this approach could be used to derive a value of hard rock conductivity by measuring the thermal conductivity of a water-saturated aggregate of rock chippings, and correcting for the water-filled spaces between the chippings. Woodside & Messmer [25] also found that a weighted geometric mean correlated well with measured thermal conductivities of sandstone samples.
Another widely used approach to bulk thermal conductivity is to take the simple arithmetic average of the weighted arithmetic mean and the weighted harmonic mean [3] of the various bulk rock components:
In this approach, the harmonic and arithmetic means are also known as the Lower and Upper Wiener bounds for a plausible thermal conductivity envelope [17] and represent thermal resistances coupled in series and in parallel, respectively [29,30].
Other authors [3] have argued that porous rocks exhibit lower bulk electrical and thermal conductivities than application of any of the above equations (based on weighted means) would predict. They argue that, by analogy with Archie’s Law (which predicts the electrical conductivity of a rock or sediment), the weighted mean estimate (λweighted mean, whether geometric, or intermediate between arithmetic and harmonic) must be multiplied by two factors:
the square of the solidity = γ2 = (1 - n)2
a correction (thermal impedance) factor Ci to account for micro-cracks and discontinuities between grains in the bulk rock, where Ci typically varies from 0.6 to 1 (lower values for basalt, intermediate for limestone and dolostone and high for granite)
where γ = solidity, the volume fraction of solid mineral phases in the rock.
Albert et al. [24] describe a semi-empirical approach based on thermal conductivity measurements of around two hundred samples of sandstones, mudstones and marlstones under both dry and water-saturated conditions. They defined a thermal conductivity differential:
They found that the dry thermal conductivity of their samples varied from 1.39 to 4.1 W/m/K, with both the highest and lowest values being recorded in sandstones. They found that water-saturated thermal conductivity varied from 2.07 to 5.27 W/m/K, with values for sandstone typically being higher than for marlstone or mudstone. They recorded values of δλ of:
0.3 ± 0.24 for sandstones (± representing two standard deviations)
0.09 ± 0.15 for mudstones
0.09 ± 0.23 for marlstones
In other words, the thermal conductivity of sandstones is far more dependent on the moisture content, than that of marlstones or mudstones. Albert et al. [24] further found that the following best-fit algorithm described the relationship of δλ with porosity (n).
They went on to propose an algorithm for estimating the fluid-saturated thermal conductivity of a porous medium, but this did not accommodate partial saturation (i.e., both air and water in the pore spaces), and will thus not be considered further in this paper.
Johansen & Frivik [31,32] modified an empirical approach developed by Kersten [14] to present a set of equations to estimate the thermal conductivity of a partially water- or ice-saturated rock [19]. This was also based on a thermal conductivity differential, but allows consideration of variable saturation:
e is the so-called Kersten number, where:
e = ∅v,sat for frozen sediments,
e = (a log10 (∅v,sat) + 1) for unfrozen soils and sediments, subject to the provision that the minimum possible value for e is 0 for soils of low moisture content [17],
a is a coefficient ranging from 0.68 for coarse materials to 0.94 for fine materials,
∅v,sat = the degree of saturation (water or ice) of the material as a volumetric fraction,
λbulk,dry = the dry bulk conductivity of the material (ideally, measured),
λbulk,sat = the saturated bulk conductivity of the material
λw = thermal conductivity of the water phase (either liquid water or ice),
λm = thermal conductivity of the mineral / particulate matter comprising the matrix,
λm = (λq^q)(λr^(1 − q)),
λq = thermal conductivity of quartz,
λr = thermal conductivity of remaining minerals = 2 W/m/K for granitic rocks, and 3 W/m/K for other rocks and sediments,
q = quartz fraction in the mineral component (between 0 and 1).
We will refer to this approach as the “Kersten-Johansen approach” and, when applying it in the following sections to idealised sandstones and limestones, will assume that λbulk,dry is approximated by the weighted geometric mean conductivities of air and mineral phases.
Each of the above approaches to thermal conductivity estimation has been applied to a highly simplified sandstone, comprising only quartz mineral and pore space filled either with air or liquid water (Figures 3a-d). For the purposes of this approach, water has been assigned a thermal conductivity of 0.58 W/m/K (at 10 °C [21]) and air a thermal conductivity of 0.02623 W/m/K [33]. The thermal conductivity of quartz is highly anisotropic with values of around 6.2 W/m/K (λperp) perpendicular to and 10.7 W/m/K (λpar) parallel to the crystal c-axis [18,34–36]. In this paper, we have used the bulk value at 10 °C, cited by Farouki [15], of 7.86 W/m/K for a randomly orientated polycrystalline quartz aggregate, given by the geometric mean
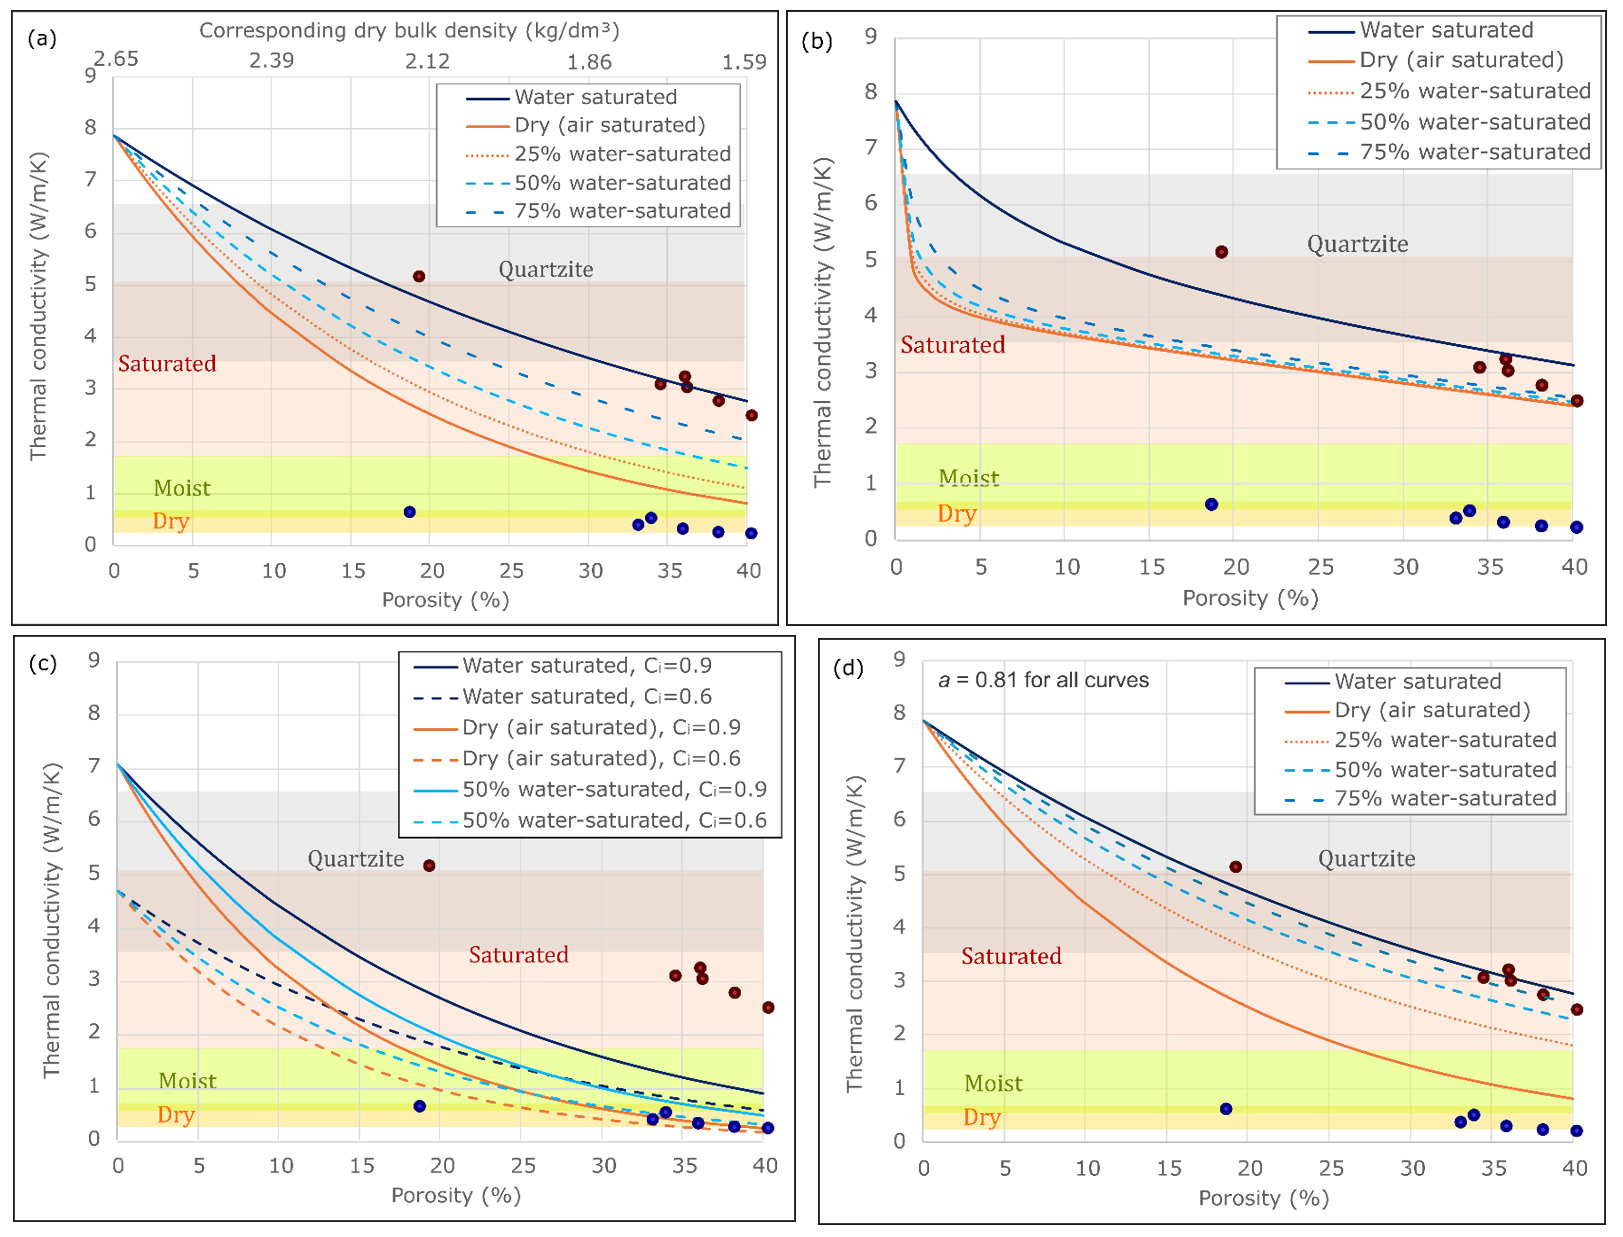
Figure 3 Calculated values of bulk thermal conductivity for a pure quartz sand/sandstone, as a function of porosity and water saturation (% of porosity by volume). Dry bulk density is calculated assuming the density of quartz is 2.65 kg/dm3 [37]. The methods of estimation used are (a) weighted geometric means of components, (b) average of weighted harmonic and arithmetic means of components, (c) an Archie’s Law analogy applied to a weighted geometric mean, (d) the Kersten-Johansen approach (where the dry bulk conductivity is taken as the weighted geometric mean of the air and mineral phases, and the parameter a is set to 0.81). The coloured fields show the range of values recommended for dry, moist and saturated sand, and quartzite in the database of Blomberg et al. [6]. The blue and red circles show experimental values for dry and water-saturated quartz sand packs from Woodside and Messmer [20].
To derive Figures 3 a-d, equations (5-9) and (12) have simply been programmed into an Excel spreadsheet and the input parameters systematically varied.
In Figures 3a-d, the theoretically calculated values for porosities in the range 0–40% (corresponding with dry bulk densities of 2.65 to 1.59 kg/dm3, assuming a density of 2.65 kg/dm3 for quartz [37]) are compared with the range of values reported by Blomberg et al. [6]. Furthermore, the results are compared to empirical data points for dry and water-saturated quartz sand packs, reported by Woodside & Messmer [20].
For context, a literature survey reported by Dalla Santa et al. [8] suggested values in the range 0.72 to 6.50 W/m/K for sandstones, which values are reflected in the UNDP-Cheap GSHPs database, with a “recommended” value of 2.60 W/m/K. In common with many other databases, it is not clearly specified whether these values apply to saturated, unsaturated or dry rocks.
The methods based on simple geometric mean (Figure 3a) and the Kersten-Johansen approach (Figure 3d) yield similarly shaped curves, which tend to span the range of commonly observed values (0.7 to 6.5 W/m/K [8]). Neither method reproduces the very lowest thermal conductivities reported for “dry” sands by Blomberg et al. [6] and by Woodside & Messmer [20]. The Kersten-Johansen approach (Figure 3d) predicts a strong decline in thermal conductivity as degree of water saturation falls below 50%.
The method based on the average of weighted arithmetic and harmonic means (Figure 3b) seems to be an unsatisfactory approach, tending to yield values in the range 2.5 to 3.5 W/m/K for all water-unsaturated cases, except low porosity sandstones, and returning values >2 W/m/K even for dry, porous sands.
The method based on analogy with Archie’s Law (Figure 4c) returns a much greater span of results, including satisfactorily high results for low porosity rocks and the very low values characteristic of dry sands. For high-porosity sediments, however, it returns unsatisfactorily low conductivities for conditions of full water saturation.
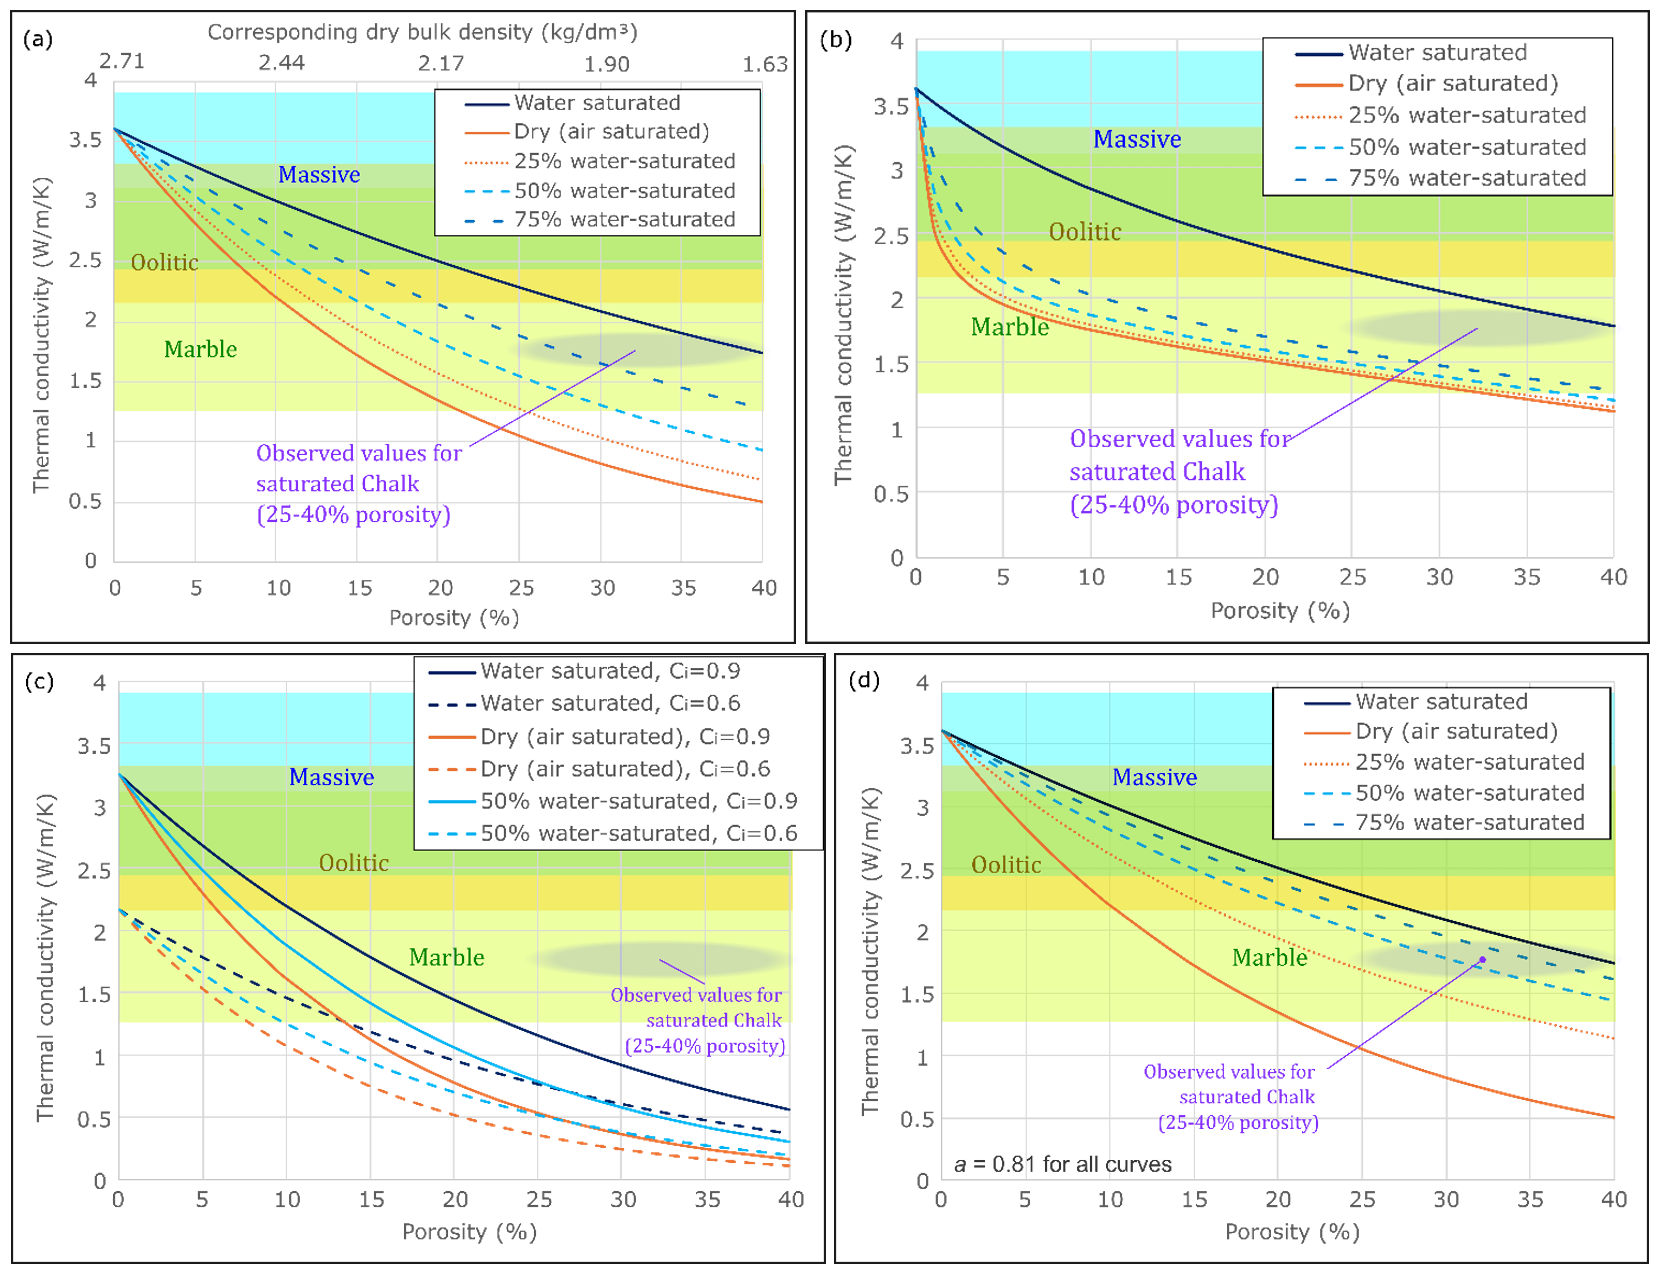
Figure 4 Calculated values of bulk thermal conductivity for a calcite limestone, as a function of porosity and water saturation (% of porosity by volume). Dry bulk density is calculated assuming the density of calcite is 2.71 kg/dm3 [40]. The methods of estimation used are (a) weighted geometric means of components, (b) average of weighted harmonic and arithmetic means of components, (c) an Archie’s Law analogy applied to a weighted geometric mean, (d) the Kersten-Johansen approach (where the dry bulk conductivity is taken as the weighted geometric mean of the air and mineral phases, and the parameter a is set to 0.81). The coloured fields show the range of values recommended for massive, oolitic and marble limestone in the database of Blomberg et al. [6] and observed for saturated English Chalk in empirical borehole-scale thermal response tests [38].
An identical approach has been applied to a highly simplified limestone, comprising only calcite mineral and pore space filled either with air or water. For the purposes of this, calcite is assigned a thermal conductivity of 3.61 W/m/K, being the average of values cited by [18,35].
In Figures 4a-d, the theoretically calculated values for porosities in the range 0–40% are compared with the range of values reported by Blomberg et al. [6] and also to field determined thermal conductivities of (mostly saturated) English Chalk [38] via borehole-scale thermal response tests. The Chalk tends to have a high porosity of 25%–40% [39].
For comparison, a literature survey reported by Dalla Santa [8] suggested values in the range 0.60 to 5.01 W/m/K for limestones, which values are reflected in the UNDP-Cheap GSHPs database, with a recommended value of 2.50 W/m/K. In common with many other databases, it is not clearly specified whether these values apply to saturated, unsaturated or dry rocks.
All four methods span most of the range of values reported by [6,8], although the method based on analogy with Archie’s Law predicts very low conductivities as porosity increases above 25%. When we compare with the relatively well-known thermal conductivity of saturated English Chalk [38], only the Archie’s Law method (Figure 4c) predicts values that are unrealistically low.
The previous section compared estimated composite thermal conductivities with published values for sands, sandstones and limestones, where the exact state of saturation and porosity and the experimental conditions are not necessarily clearly documented.
To provide a more rigorous comparison with experimental data, the algorithms for estimating thermal conductivity of three-phase (one mineral phase plus air plus water) composite geological materials have been compared with empirical thermal conductivity data published by Miles Kersten [13] and by Woodside & Messmer [25].
Kersten [13] measured the variation of thermal conductivity of a range of natural and artificial unconsolidated granular materials under conditions of varying temperature, density (degree of compaction, which in turn reflects porosity) and moisture content. Five of Kersten’s materials are predominantly quartz-based and thus lend themselves to comparison with the curves presented in Figures 3a-d. The five materials selected for comparison are:
Material P4604, Lowell sand. A medium-grained sand comprising 72.2% quartz and 20.5% orthoclase, with a grain specific gravity of 2.67.
Material P4701. Graded Ottawa sand. A medium-grained sand comprising over 99% quartz, with a grain specific gravity of 2.65.
Material P4702. 20-30 Ottawa sand. A medium-grained sand comprising over 99% quartz, with a grain specific gravity of 2.65.
Material P4703. Crushed quartz. Comprising >95% quartz crushed to a coarse sand grade (15.5% gravel grade, 5.5% silt or clay grade), with a grain specific gravity of 2.65.
Material P4714. Fine crushed quartz. Comprising >95% quartz crushed to a medium sand grade, with a grain specific gravity of 2.65.
The data collected by Kersten [13] were extracted for these five materials for an experimental temperature of +4 °C (the effect of increasing temperature from +4 to +20 °C was typically less than 10% on the thermal conductivity [17]). Measured thermal conductivity was converted to W/m/K using a conversion factor of 1 Btu/ft2/in/hr/°F = 0.144 W/m/K and the dry bulk density of the material was converted using 1 lb/ft3 = 16.018 kg/m3. The moisture content (originally cited as weight-% relative to dry weight) was converted to a volumetric percent by multiplying by dry bulk density. Porosity was estimated from dry bulk density and grain specific gravity, and state of saturation was estimated by dividing moisture content by porosity. It was found that the experimental materials typically had a relatively high porosity of 27 to 46%. The state of saturation ranged from effectively dry (0%) to 79%, although the majority of samples were relatively dry with a state of saturation of <25%.
Figure 5 shows the dependence of the thermal conductivity of the five materials on (left) sample porosity and (right) water saturation. It can be seen that, as porosity decreases there is a broad tendency for thermal conductivity to increase, although there is a very large spread of data caused by the varying degrees of saturation of the measured samples: for each given sample porosity, the thermal conductivity often exhibits a three- to four-fold spread, due to the differing experimental states of moisture content. The dependence of thermal conductivity on water saturation is easier to see, as the majority of the samples have a high porosity, typically in the range 34-42%. Thermal conductivity increases strongly as moisture content increases: the highest conductivities are for the quartz rich Ottawa sand and the crushed quartz, while lower conductivities are observed for the somewhat feldspathic Lowell sand.
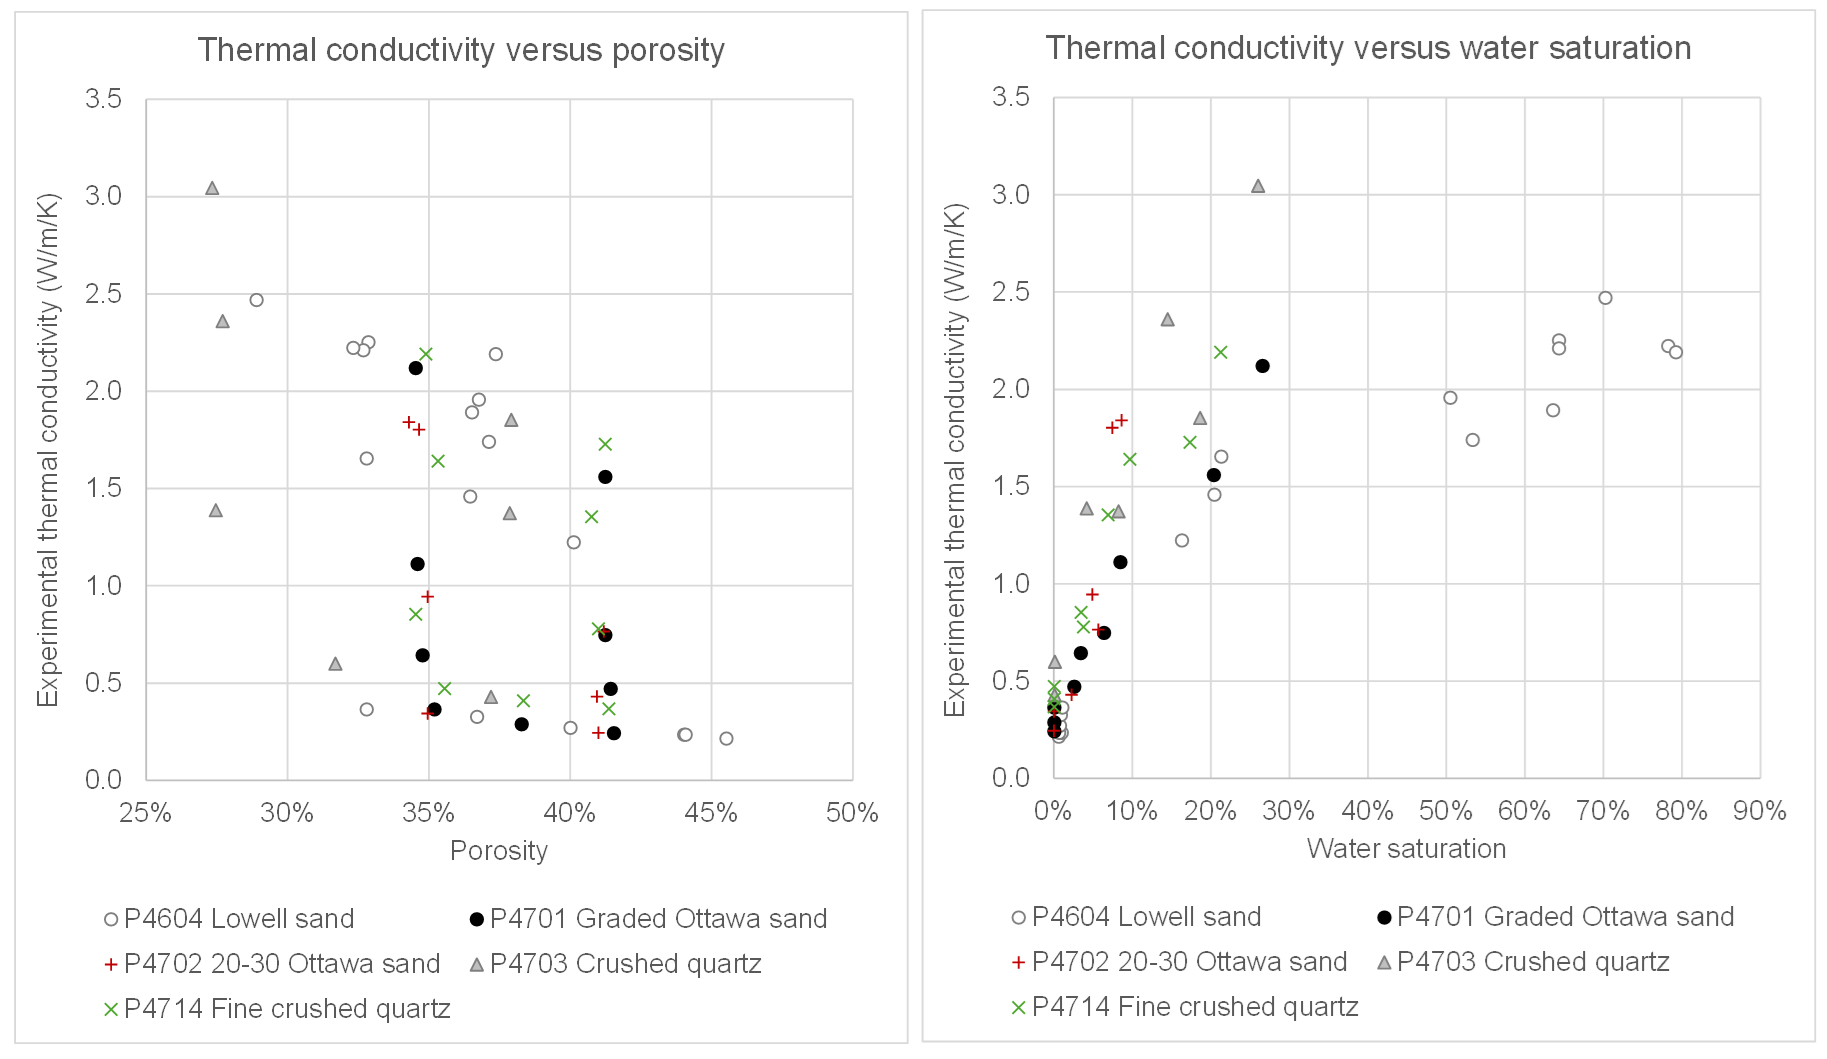
Figure 5 Dependence of experimental thermal conductivity of Kersten’s [13] five selected partially saturated quartz sand materials on (left) porosity and (right) state of water saturation. All data at 4.2 to 4.5 °C.
Because Kersten’s [13] data are biased towards high-porosity unconsolidated sands, data for six sandstones were also extracted from Woodside & Messmer’s [25] paper. The thermal conductivity of these sandstones was only measured in the dry (0% water saturation) and fully (100%) saturated conditions, at 30 °C. The sandstones were:
the Berkeley Sandstone: 3% porosity, mineral fraction = 98-99% quartz
St Peters Sandstone: 11% porosity, mineral fraction = 98-99% quartz
Tensleep Sandstone: 15.5% porosity, mineral fraction = 90-95% quartz
Berea Sandstone: 22% porosity, mineral fraction = 88-89% quartz
Teapot Sandstone: 29% porosity, mineral fraction = 88% quartz
Tripolite: 59% porosity, mineral fraction = 85–90% quartz. This is a chert rather than a sandstone, and is unusual in being highly porous [41].
The available data for Kersten’s [13] samples allowed thermal conductivity to be estimated from the porosity and mineral and fluid fractions, using the following four methods, and compared with the experimental determinations: (a) geometric mean, (b) average of harmonic and arithmetic mean, (c) Archie’s Law analogy, with Ci = 0.9, (d) Kersten-Johansen approach with a = 0.81 (as the sediments are neither excessively coarse- nor fine-grained). Moreover, a similar estimation of thermal conductivity in dry and saturated states could be made for Woodside & Messmer’s [25] sandstone samples for methods (a) to (c) (Figures 6-9).
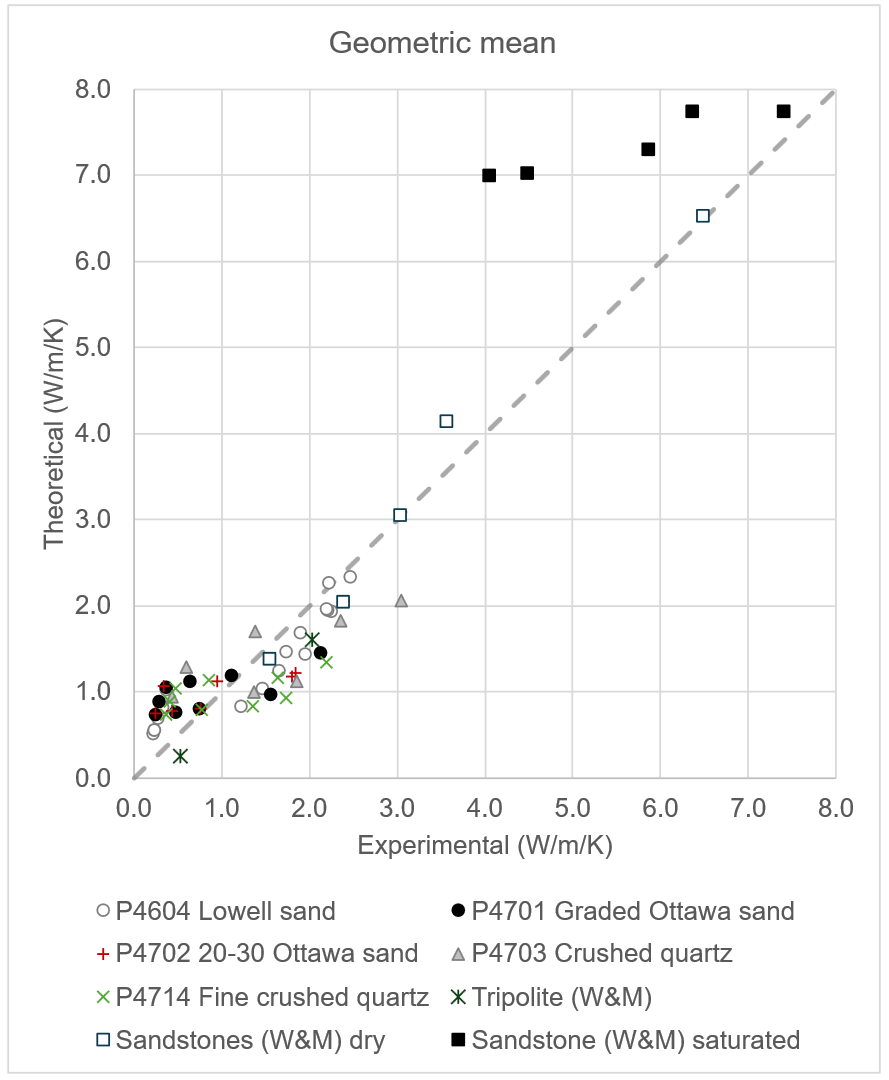
Figure 6 Comparison of thermal conductivity estimated as weighted geometric mean of components, compared with experimentally determined conductivity for (a) three quartzic sands and two samples of crushed quartz from Kersten’s [13] data set (all marked Pxxxx), at varying states of water saturation and (b) the six sandstones from Woodside & Messmer’s [25] data set in dry and water-saturated condition (marked Sandstones (W&M)).
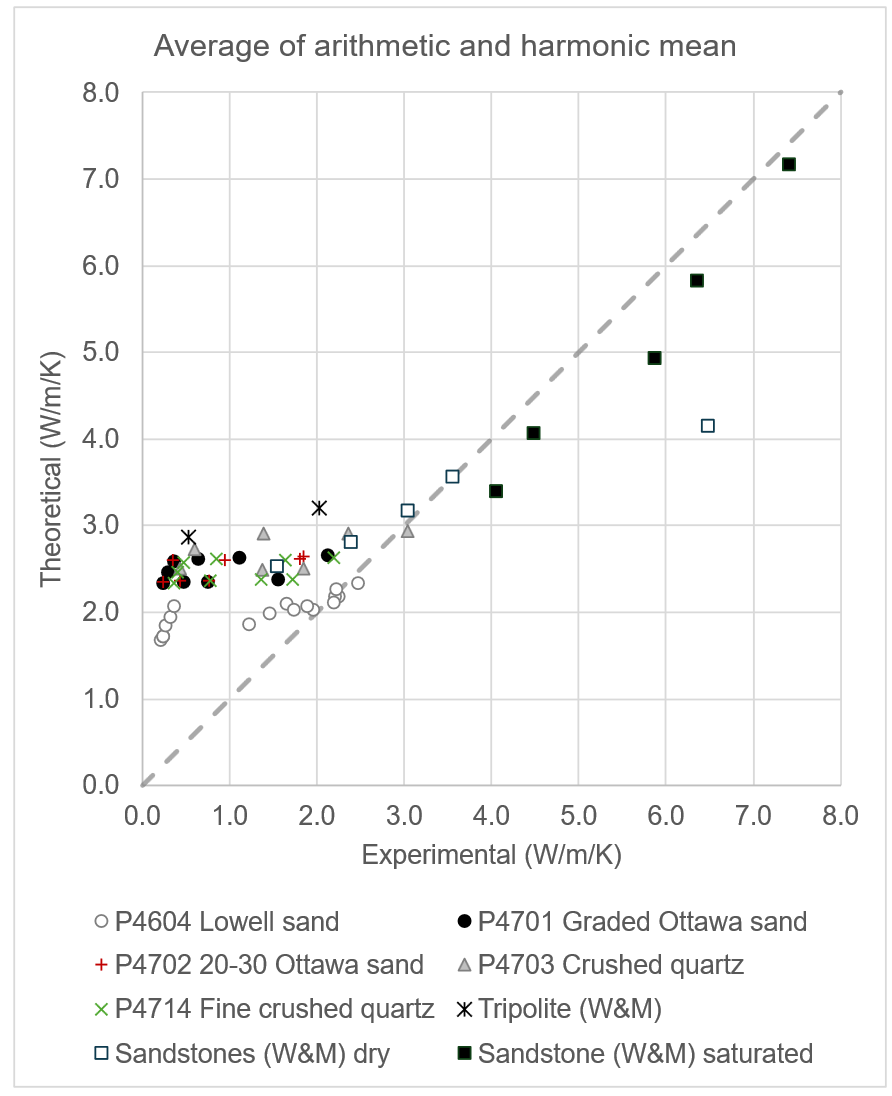
Figure 7 Comparison of thermal conductivity estimated as average of weighted arithmetic and harmonic means of components, compared with experimentally determined conductivity for the same samples as documented in Figure 6.
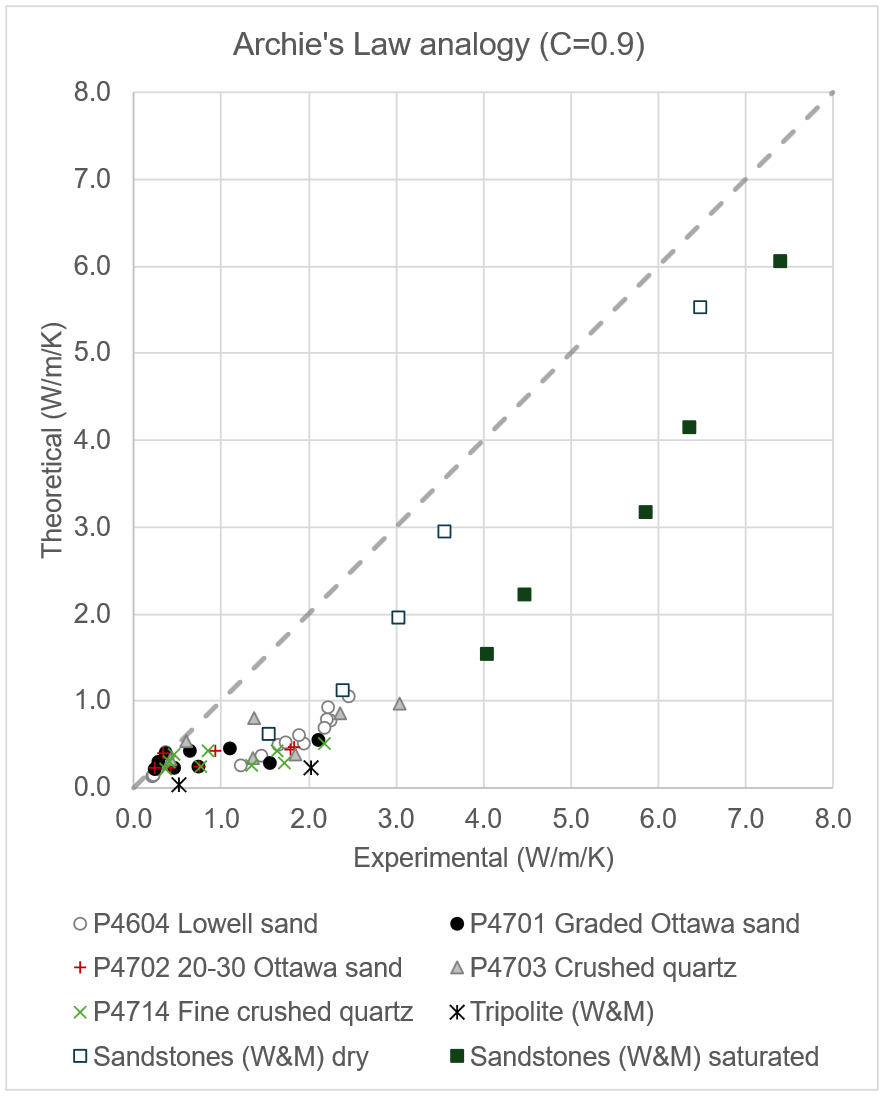
Figure 8 Comparison of thermal conductivity, based on weighted geometric mean, but corrected by analogy with Archie’s Law (Ci = 0.9), compared with experimentally determined conductivity for same samples as documented in Figure 6.
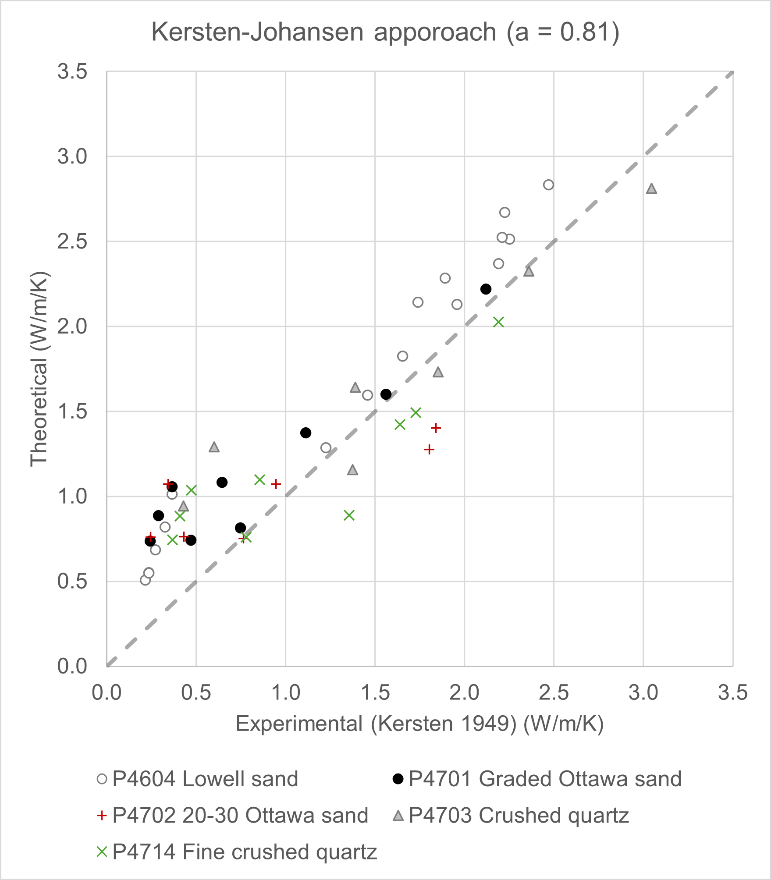
Figure 9 Comparison of thermal conductivity, based on the Kersten-Johansen approach, setting a = 0.81, compared with experimentally determined conductivity for three quartzic sands and two samples of crushed quartz from Kersten’s [13] data set, at varying states of water saturation. Dry bulk thermal conductivity was estimated as the weighted geometric mean of the conductivities of the mineral component and of air.
For each approach, the mineral conductivity was set to that of quartz (7.86 W/m/K) for all of Kersten’s [13] samples except the Lowell Sand, which only comprises 72.2% quartz. For this, the mineral conductivity was set to (7.86^0.722)*(3*0.278) = 6.01 W/m/K, as recommended in Section 3.4. Similarly, for Woodside & Messmer’s [25] samples, the weighted geometric mean of quartz thermal conductivity and that of the remaining mineral fraction (set to 3 W/m/K), was used for the mineral fraction. The Kersten-Johansen approach should ideally use an empirical value of dry bulk thermal conductivity, but for the purpose of this approach, this was estimated as the weighted geometric mean of the conductivities of the mineral component and of air.
It will be seen that method (b) tends to overestimate thermal conductivity in most relatively unsaturated samples, and to produce conductivities of around 2.5 W/m/K, even in quite dry samples. This is consistent with what is observed in Figure 3b. It produces considerably better results in samples with a high moisture content (Figure 7).
Method (c) consistently underestimates the conductivity of most samples, though it is able to reproduce the conductivity of many if the driest (lowest conductivity) samples to an acceptable degree (Figure 8). This is consistent with Figure 3c, at least for sands of >25% porosity - which is the case for Kersten’s [13] samples under consideration here.
Despite its simplicity, method (a) is able to predict experimental thermal conductivity (at least in quartz sands and sandstones) across a wide range of states of saturation. The method does exhibit a high degree of scatter, however, and tends to overestimate the conductivity of the driest sediments. It arguably also has a tendency to overestimate the conductivity of the saturated sandstones (Figure 6).
The best correlation between experimental and estimated data is for the Kersten-Johansen approach, and this should be unsurprising as it was this sample set that Johansen [16,17] used to derive the predictive algorithm (Figure 9). The predicted conductivities in the driest samples are systematically somewhat higher than the empirical data; this can be ascribed to an estimated dry bulk conductivity being used in the algorithm, rather than the recommended experimental dry bulk conductivity.
Volumetric heat capacity is a scalar quantity. The value of this parameter for a bulk rock or sediment (comprising mineral matrix, air and/or water in pore spaces) can be calculated as a volume-weighted arithmetic mean of the component phases. Care should, however, be taken, when considering rocks or sediments that change volume, change phase, dissolve or react on contact with water (e.g., clays, anhydrite, halite).
The volumetric heat capacity of water is exceptionally high (around 4.2 MJ/m3/K), while that of air is extremely low. The volumetric heat capacity of porous rocks and sediments is thus highly dependent on their state of water saturation. It is thus important to measure and control the state of saturation when empirically determining volumetric heat capacity.
Thermal conductivity is a tensor quantity. It cannot be reliably estimated by any single algorithm, as the bulk conductivity of a composite geological material will depend not only on porosity and degree of saturation, but also on grain shape, grain orientation, texture and layering, degree of contact between mineral grains (cementation, grain distortion, grain boundaries) and degree of fracturing.
Four methods of estimating bulk thermal conductivity have been explored:
A simple weighted geometric mean.
The arithmetic average of the Lower and Upper Wiener bounds on composite conductivity (weighted arithmetic and weighted harmonic means).
A correction to the weighted geometric mean based on analogy with Archie’s Law.
The semi-empirical method suggested by Johansen [16,17], largely on the basis of experimental data from Kersten [13,14]. See also [19].
Comparison with both (a) generic data sets of thermal conductivity of geological materials [6-8] and (b) with specific experimental data on porous sands and sandstones [13,14,25], suggests the following conclusions.
The Wiener bounds approach (average of weighted arithmetic and harmonic means) tends to overestimate the thermal conductivity of unsaturated porous materials quite significantly. It is relatively good, however, at predicting the thermal conductivity of water-saturated sands and sandstones.
The Archie’s Law approach tends to underestimate composite thermal conductivity of porous materials. An exception is the case of dry sands, where it results in rather good estimates (which the other methods considered are unable to replicate).
The semi-empirical Kersten-Johansen approach appears to be a good method for estimating the thermal conductivity of porous sandy materials at varying states of compaction and saturation, although its applicability to lithified rocks and non-silicate lithologies has yet to be demonstrated.
The simple weighted geometric mean remains the most broadly applicable “first pass” method for estimating the bulk thermal conductivity of composite geological materials of varying saturation and porosity, in the absence of empirical data. It is not good, however, at predicting the thermal conductivity of dry porous geological materials.
All investigated methods predict that thermal conductivity of composite rocks and sediments will vary strongly with degree of water saturation and porosity. When citing volumetric heat capacity or thermal conductivity of a rock or sediment, great care should be taken to specify whether the cited figure applies to:
a dry bulk sample;
a water-saturated bulk sample;
a bulk sample under some intermediate, field condition;
or, merely, to the mineral component of the geological material.
Similarly, when an analytical or numerical model used in the design of geothermal or ground source heat systems requires a value of heat capacity or thermal conductivity, the manual or model instructions should be clear as to whether the model requires a bulk value (as in the case of the model Earth Energy Designer [6]) and, if so, which bulk value – dry, field or water-saturated. Alternatively, a model may require separate values relating specifically to the mineral or fluid phases, as in the case of FEFLOW [42,43].
This paper concludes by wholly supporting Johansen’s [17] assertion that “predictions of thermal conductivities of dry and moist soils in general must rely on empirical correlations”, with the caveat that “for water or ice saturated soils… the geometric mean equation has been found to provide a good estimate of the thermal conductivity”.
| 1. | Banks D. An introduction to thermogeology: ground source heating and cooling. (2nd ed.). Chichester: John Wiley & Sons; 2012. 526 p. ISBN:9780470670347. [Google Scholar] |
| 2. | Rollin KE. Investigation of the geothermal potential of the UK. Catalogue of geothermal data for the land area of the United Kingdom. 3rd rev. Keyworth (UK): British Geological Survey; 1987. Report no. WJ/GE/87/007. Available from: https://nora.nerc.ac.uk/id/eprint/537114 (accessed 2024 Oct 9). [Google Scholar] |
| 3. | Robertson EC. Thermal properties of rocks. Reston (VA): United States Geological Survey; 1988. Open-file report 88-441. Available from: https://pubs.usgs.gov/of/1988/0441/report.pdf (accessed 2024 Oct 9). [Google Scholar] |
| 4. | Waples DW, Waples JS. A review and evaluation of specific heat capacities of rocks, minerals, and subsurface fluids. Part 1: minerals and nonporous rocks. Nat Resour Res. 2004;13(2):97-122. [Google Scholar] [CrossRef] |
| 5. | Waples DW, Waples JS. A review and evaluation of specific heat capacities of rocks, minerals, and subsurface fluids. Part 2: fluids and porous rocks. Nat Resour Res. 2004;13(2):123-130. [Google Scholar] [CrossRef] |
| 6. | Blomberg T, Claesson J, Eskilson P, Hellström G, Sanner B. Earth energy designer (EED) version 4.20. Sweden: BLOCON AB; 2019. [Google Scholar] |
| 7. | Galgaro A, Dalla Santa G, De Carli M, Emmi G, Zarrella A, Mueller J, et al. New tools to support the designing of efficient and reliable ground source heat exchangers: the Cheap-GSHPs databases and maps. Adv Geosci. 2019;49:47-55. [Google Scholar] [CrossRef] |
| 8. | Dalla Santa G, Galgaro A, Sassi R, Cultrera M, Scotton P, Mueller J, et al. An updated ground thermal properties database for GSHP applications. Geothermics. 2020;85:101758. [Google Scholar] [CrossRef] |
| 9. | Microgeneration Certification Scheme (MCS). Heat pump reference information and tools. MGD-007 Issue 1.0. Daresbury (UK): MCS Charitable Foundation; 2021. Available from: https://mcscertified.com/wp-content/uploads/2021/10/MGD-007-Reference-Information-and-Tools-Issue-1.0.pdf (accessed 2024 Oct 9). [Google Scholar] |
| 10. | British Geological Survey (BGS). UK digital geothermal catalogue, version 1. Keyworth (UK): British Geological Survey; 2024. [Google Scholar] [CrossRef] |
| 11. | Fellgett M, Monaghan AA. User guide: BGS UK geothermal catalogue first digital release, legacy data. Keyworth (UK): British Geological Survey; 2023. Open Report OR/23/060. [Google Scholar] |
| 12. | Long M, Murray S, Pasquali R. Thermal conductivity of Irish rocks. Irish J Earth Sci. 2018;36:63-80. [Google Scholar] [CrossRef] |
| 13. | Kersten MS. Thermal properties of soils. Minneapolis: University of Minnesota, Institute of Technology Engineering Experimental Station; 1949. Bulletin 28. 227 p. Available from: https://hdl.handle.net/11299/124271 (accessed 2025 Jan 15). [Google Scholar] |
| 14. | Kersten MS. Final report: laboratory research for the determination of the thermal properties of soils. St Paul (MN): US Army Corps of Engineers; Minneapolis: University of Minnesota, Engineering Experiment Station; 1949. Available from: https://erdc-library.erdc.dren.mil/items/81b728f7-6d82-4ef8-e053-411ac80adeb3/full (accessed 2024 Oct 23). [Google Scholar] |
| 15. | Farouki O. Evaluation of methods for calculating soil thermal conductivity. Hanover (NH): US Army Corps of Engineers, Cold Regions Research Engineering Laboratory; 1982. Report CRREL-82-8. 90 p. Available from: https://apps.dtic.mil/sti/citations/tr/ADA117889 (accessed 2025 Jan 15). [Google Scholar] |
| 16. | Johansen Ø. Thermal conductivity of soils. Trondheim: Institutt for Kjøleteknikk, NTH; 1975. 231 p. Available from: https://www.researchgate.net/publication/235140845_Thermal_Conductivity_of_Soils (accessed 2025 Jan 15). [Google Scholar] |
| 17. | Johansen Ø. Thermal conductivity of soils revisited. Trondheim: Johansen Environmental Modeling; 2024. 19 p. [Google Scholar] [CrossRef] |
| 18. | Birch F, Clark H. The thermal conductivity of rocks and its dependence on temperature and composition. Am J Sci. 1940;238(8):529–558. Available from: https://ajsonline.org/article/57927 (accessed 2025 Jan 15). |
| 19. | Clauser C, Huenges E. Thermal conductivity of rocks and minerals. In: Ahrens TJ, editor. Rock physics & phase relations: a handbook of physical constants. Washington (DC): American Geophysical Union; 1995. p. 105–126. [CrossRef] |
| 20. | Woodside W, Messmer JH. Thermal conductivity of porous media. I. Unconsolidated sands. J Appl Phys. 1961;32(9):1688-1699. [Google Scholar] [CrossRef] |
| 21. | Melinder Å. Properties of secondary working fluids for indirect systems. Paris: International Institute of Refrigeration; 2010. [Google Scholar] |
| 22. | Engineering Toolbox. Air - specific heat vs. temperature at constant pressure; 2024 Available from: https://www.engineeringtoolbox.com/air-specific-heat-capacity-d_705.html (accessed 2024 Oct 9). |
| 23. | Engineering Toolbox. Air - density, specific weight and thermal expansion coefficient vs. temperature and pressure; 2024 Available from: https://www.engineeringtoolbox.com/air-density-specific-weight-d_600.html (accessed 2024 Oct 9). |
| 24. | Albert K, Schulze M, Franz C, Koenigsdorff R. Thermal conductivity estimation model considering the effect of water saturation explaining the heterogeneity of rock thermal conductivity. Geothermics. 2017;66:1-12. [Google Scholar] [CrossRef] |
| 25. | Woodside W, Messmer JH. Thermal conductivity of porous media. II. Consolidated rocks. J Appl Phys. 1961;32(9):1699-1706. [Google Scholar] [CrossRef] |
| 26. | Klinkenberg LJ. The permeability of porous media to liquids and gases. Am Pet Inst Drilling Prod Pract. 1941;200-213. [Google Scholar] [CrossRef] |
| 27. | Jones RH. Properties of freezing, frozen and thawed soils. In: Harris JS, editor. Ground freezing in practice. London: Thomas Telford; 1995. p. 27–69. |
| 28. | Sass JH, Lachenbruch AH, Munroe RJ. Thermal conductivity of rocks from measurements on fragments and its application to heat-flow determinations. J Geophys Res. 1971;76(14):3391-3401. [Google Scholar] [CrossRef] |
| 29. | Brown WF. Solid mixture permittivities. J Chem Phys. 1955;23:1514-1517. [Google Scholar] [CrossRef] |
| 30. | Golden K. Bounds on the complex permittivity of a multicomponent material. J Mech Phys Solids. 1985;34(4):333-358. [Google Scholar] [CrossRef] |
| 31. | Frivik PE. State-of-the-art report. Ground freezing: thermal properties, modelling of processes and thermal design. Eng Geol. 1981;18:115-133. [Google Scholar] [CrossRef] |
| 32. | Johansen Ø, Frivik PE. Thermal properties of soils and rock minerals. In: Proc 2nd Int Symp Ground Freezing; 1980; Trondheim. Vol 1. p. 427–453. |
| 33. | Kadoya K, Matsunaga N, Nagashima A. Viscosity and thermal conductivity of dry air in the gaseous phase. J Phys Chem Ref Data. 1985;14:947-970. [Google Scholar] [CrossRef] |
| 34. | Powell RW, Ho CY, Liley PE. Thermal conductivity of selected materials. Natl Stand Ref Data Ser (US National Bureau of Standards). 1966;8:139. [Google Scholar] |
| 35. | Horai K, Simmons G. Thermal conductivity of rock-forming minerals. Earth Planet Sci Lett. 1969;6:359-368. [Google Scholar] [CrossRef] |
| 36. | Crystran. Quartz crystal (SiO2) – materials data. Dorset, UK: Crystran; 2024. Available from: https://www.crystran.com/media/wysiwyg/Datasheets/quartz-crystal-sio2-data-sheet.pdf (accessed 2025 Jan 15). [Google Scholar] |
| 37. | MinDat. Quartz; 2024 Available from: https://www.mindat.org/min-3337.html (accessed 2025 Jan 15). |
| 38. | Banks D, Withers JG, Cashmore G, Dimelow C. An overview of the results of 61 in situ thermal response tests in the UK. Q J Eng Geol Hydrogeol. 2013;46:281-291. [Google Scholar] [CrossRef] |
| 39. | British Geological Survey (BGS). Properties of the Chalk aquifer in the Thames Basin; 2024 Available from: https://www2.bgs.ac.uk/groundwater/waterResources/thames/chalk.html (accessed 2024 Oct 16). |
| 40. | MinDat. Calcite; 2024 Available from: https://www.mindat.org/min-859.html (accessed 2025 Jan 15). |
| 41. | Aboaba O, Liner C. Characterization of paleokarst Mississippian chat and tripolite zones in Osage County, Oklahoma, USA. In: Proc 1st Int Meet Appl Geosci Energy. 2021 Sep. [Google Scholar] [CrossRef] |
| 42. | Diersch HJG. FEFLOW: finite element modeling of flow, mass and heat transport in porous and fractured media. Berlin, Heidelberg: Springer; 2014. 996 p. [Google Scholar] [CrossRef] |
| 43. | DHI. FEFLOW 8.0 documentation. Material properties – heat; 2025 Available from: https://download.feflow.com/html/help80/feflow/09_Parameters/Material_Properties/heat_parameters.html#Heat_Conductivity (accessed 2025 Feb 5). |

![]()
Copyright © 2026 Pivot Science Publications Corp. - unless otherwise stated | Terms and Conditions | Privacy Policy


