
Green Energy and Sustainability ISSN 2771-1641
Green Energy and Sustainability 2023;3(2):0002 | https://doi.org/10.47248/ges2303020002
Original Research Open Access
Biomass productivity of Microchloropsis gaditana cultivated in a variety of modes and effect of cobalt and molybdenum on its lipid distribution
George Papapolymerou
1

 ,
Ioannis Τ. Karapanagiotidis
2
,
Nikolaos Katsoulas
3
,
Maria N. Metsoviti
1
,
Elli Z. Gkalogianni
2
,
Ioannis Τ. Karapanagiotidis
2
,
Nikolaos Katsoulas
3
,
Maria N. Metsoviti
1
,
Elli Z. Gkalogianni
2
Correspondence: George Papapolymerou
Academic Editor(s): Petros Gikas, Justin Chun-Te Lin, Anthoula Manali, Konstantinos Tsamoutsoglou
Received: Jan 18, 2023 | Accepted: Mar 30, 2023 | Published: Apr 25, 2023
This article belongs to the Special Issue Selected Papers from the 1st International Conference on Sustainable Chemical and Environmental Engineering
© 2023 by the author(s). This is an Open Access article distributed under the terms of the Creative Commons License Attribution 4.0 International (CC BY 4.0), which permits unrestricted use, distribution, and reproduction in any medium or format, provided the original work is correctly credited.
Cite this article: Papapolymerou G, Karapanagiotidis I, Katsoulas N, Metsoviti M, Gkalogianni E. Biomass productivity of Microchloropsis gaditana cultivated in a variety of modes and effect of cobalt and molybdenum on its lipid distribution. Green Energy Sustain 2023; 3(2):0002. https://doi.org/10.47248/ges2303020002
The autotropic, heterotrophic and mixotrophic cultivation mode of the microalgae Microchloropsis gaditana was studied. Three sets of experiments were carried out: In the first set, six experimental groups were tested; one autotrophic, one heterotrophic and four mixotrophic where cultivation modes carried out and biomass productivities were compared to each other. In the second and in the third set of experiments, the algae were exposed to four or five concentrations of cobalt (Co) or of molybdenum (Mo) respectively; in these sets of experiments the effect of Co and Mo on the biomass productivity and on the lipid content and distribution of M. gaditana was examined. In the 1st set of experiments, the mixotrophic cultivations, the initial carbon concentration, C(0), was equal to 2.87 g/L, 2.92 g/L, 3.96 g/L and 4.96 g/L and in the heterotrophic cultivation C(0) was equal to 2.24 g/L. Nitrogen initial concentration, Ν(0), was held constant at 77.1 mg/L. For the heterotrophic and the three mixotrophic cultivations, the biomass yield, when expressed as g/(per L-g of added carbon) was highest for the heterotrophic growth. In the 2nd and 3rd sets of experiments it was found that both Co and Mo affect biomass productivity and lipid distribution. Co, even at relatively medium concentrations, strongly inhibited the growth. On the other hand, Mo, even at relatively high concentrations, did not affect substantially the growth rate of M. gaditana. The lipid distribution showed that for most treatments with varying concentrations of Co and Mo, MUFA prevailed while, n-3 PUFA up to 26.6% and 19.4% of the total FA were obtained. Lipid and protein contents of the biomass for the treatments with Co were up to 8.18% and 14.97% respectively, while the respective values for the treatments with Mo were higher up to 16.67% and 17.76%.
KeywordsMicrochloropsis gaditana, autotrophic, heterotrophic, mixotrophic, lipid distribution, Cobalt, Molybdenum
Microalgae can grow and produce biomass either autotrophically by using light and carbon dioxide, like plants or heterotrophically in the absence of light if an organic carbon source becomes available [1,2]. The heterotrophic growth of microalgae offers some distinct advantages over the autotrophic cultivation such as faster growth rates, higher biomass and lipid productivities and no limitations imposed by insufficient light penetration into the growth media [3]. Additionally, a better control over the process parameters such as temperature, pH, oxygen levels and carbon source can be achieved. A disadvantage of the heterotrophic growth is the potential of contamination, as well as the higher cost for equipment and installation [4]. Use of microalgae in the context of circular economy and sustainability is promising for many applications such as in the fuel industry for biofuel production, in fisheries as fish meal and in the cosmetic and pharmaceutical industry.
According to FAO, the global aquaculture industry has grown significantly in recent years. Aquaculture production was 15, 37, 58 and 90 million tons in the years 1990, 2000, 2010 and 2020 respectively [5]. This fact implies the need to increase fish feed production in order to meet the demands of aquaculture. Fishmeal consisting mainly from a variety of grains is currently the main source of protein used as fish feed. However, the overexploitation of fishing resources, combined with the increasing demand, results in a continuous increase in their price. Consequently, the expansion of aquaculture systems based on the use of fishmeal in fish feed may not be feasible. Thus, many studies have focused on the search for alternative sources of protein suitable for fish feed. Of course, certain conditions should be met, such as high protein content, sufficient fatty acids and fatty acid profile, guaranteed supply, as well as affordable cost.
It is well accepted that microalgae have excellent nutritional properties, as they contain high amounts of proteins, lipids, antioxidants, vitamins (such as A, B1, B2, B6, B12, C, E, biotin, folic acid), minerals (phosphorus, zinc, iron, calcium, selenium, magnesium) and are rich in pigments such as chlorophylls, carotenoids and phenols [6]. Some species of microalgae are rich sources of lipids with significant amounts of DHA, EPA and arachidonic acid (AA) that are essential in the diet of fish. Protein content in microalgae varies depending on the species, but also on the growing conditions. The same applies to the content in lipids. Significant amounts of polyunsaturated fatty acids (PUFAs), which are essential in the diet of fish, are also found in the biomass of microalgae [7]. Trace elements are minerals that are present in microalgal cells in extremely small amounts but, are a key component of their physiology. Iron (Fe), molybdenum (Mo), manganese (Mn), cobalt (Co), zinc (Zn), copper (Cu) and nickel (Ni) are the seven most important trace elements required by algae for their various metabolic functions [8]. Molybdenum plays an important role in the metabolic processes of microalgae [9] but, not much research has been performed on its effect on microalgal growth. Cobalt is an element which in high concentrations is toxic to microalgae. The toxicity limit varies depending on the species. In the right amounts, however, it has been shown to cause a greater accumulation of fatty acids [7].
The quality of microalgal lipids is of primary importance for their nutritional value in aquaculture. Polyunsaturated fatty acids (PUFA) such as linoleic acid (LA, C18:2n-6), α-linolenic acid (ALA, C18:3n-3), eicosapentaenoic acid (EPA, C20:5n-3), arachidonic acid (AA, C20:4n-6) and docosahexaenoic acid (DHA, C22:6n-3) are considered essential fatty acids in fish nutrition [10]. While LA and LNA are found in many plant oils [11], the only commercially adequate source of EPA and DHA for aqua feeds are currently the fish oils [12]. However, the stagnant production of fish oils [13] is forcing aquaculture to seek for new and more sustainable sources of EPA and DHA and thus microalgae species that contain these valuable fatty acids are of great interest to use in aqua feeds. The microalgae Nannochloropsis sp. is considered as a good photoautotrophic producer of high lipid content and EPA [14].
The effect of several cultivation parameters on the biomass and lipid productivities as well as on the lipid profile of Microchloropsis sp (formerly Nannochloropsis sp.) and other microalgal species have been reported in literature [15] but, studies on the effect of Co and Mo on the lipid content and the fatty acid profile are scarce. Cultivation under nitrogen starvation has been reported to lead to an increase in lipid production in Microchloropsis sp though, without affecting the percentage of EPA in the total lipid content in cultivations of Microchloropsis oculata [16] and Microchloropsis oceanica IMET1 [17]. Illumination of cultures of Microchloropsis gaditana to 6 μmol photons m−2 s−1 UVA increased the growth rate by 29% [18]. However, the EPA content decreased by about 10% [18]. Also, in another study, an increase in light intensity from 10 to 1000 μmol photons m−2 s−1 led to an increase in the lipid content but it did not result in an increase in the content of EPA [19]. The light wavelength is reported to have an effect on the lipids of Microchloropsis sp [20]. Blue light increases the growth rate by 8% in autotrophic cultures of Microchloropsis sp. but it leads to significant decrease, about 50%, in the EPA content relative to white light.
The effect of a variety of growth parameters, such as the salinity and the photon density, on the lipid and EPA productivities of N. gaditana was also studied [21]. For a wide salinity range from 20 to 40 g/L, the maximum biomass productivity was obtained at 20 g/L. An increase in salinity from 30 to 40 g/L reduced the biomass, the lipid and the EPA productivities. The high photon density of 150 μmol photons m−2 s−1 was found to increase the biomass productivity as well as the lipid productivity but resulted in relatively lower EPA synthesis. With respect to the light:dark cycles, the 18h:06h and 12h:12h photoperiods increased the EPA content, whereas the 06h:18h and the 00h:24h photoperiods caused a notable decrease in the EPA content. The 24h:00h photoperiod regime decreased the EPA percentage [21]. During the autotrophic growth of N. gaditana a maximum biomass concentration of 0.96 g L−1 and a maximum lipid productivity of 16.8 mg L−1 d−1 were observed using a desalination concentrate of 75%. Increasing the desalination concentrate decreases the percentage of C20:5n3 and increases the percentage of C16:0 [22]. Microchloropsis sp (strain strain 211/78, CCAP) was cultivated in flat plate bioreactors. The maximum cell density reached 4.7 g L−1 and the maximum productivity was 0.51 g L−1 d−1. During nutrient replete conditions, EPA and total protein concentrations measured from 4.2% to 4.9% and from 50% to 55% of the dry mass, respectively. Nutrient starvation induced the accumulation of fatty acids up to 28.3% of the cell dry weight, largely due to the incorporation of C16:0 and C16:1n-7 fatty acyl chains into neutral lipids. During nutrient starvation the total EPA content did not change. FA ranged from C:10 to C:205n-3 while, the EPA percentage ranged from 41.5% to 49.3% [23].
In this work the microalgal species Microchloropsis gaditana was cultivated in a variety of modes in three separate sets of experiments (treatments). The aim of this study was two-fold: (a) to examine how different modes of cultivation such as autotrophic, heterotrophic and mixotrophic affect the biomass productivity and the carbon uptake rate and also to examine how the initial organic carbon concentration in the growth media of the heterotrophic and mixotrophic cultivations affect the biomass productivity and the carbon uptake rate and (b) to examine the effect of the concentration of two micronutrients, namely Mo and Co on (i) the biomass productivity, (ii) the lipid and protein content and (iii) the fatty acid (FA) distribution for the autotrophic cultivation. The three separate sets of cultivations were: (a) six cultivations in which one was autotrophic, one heterotrophic and four mixotrophic, (b) four autotrophic cultivations in which the Co concentration was varied keeping all the other micronutrients and the macronutrients the same and (c) five autotrophic in which the Μo concentration was varied keeping all the other micronutrients and the macronutrients the same. This work provides information on how the biomass productivity of M. gaditana is affected by the mode of cultivation and the initial carbon concentration and how the two micronutrients, Co and Mo affect the biomass yield and the lipid profile of this microalgae species.
Table 1(a–c) shows the set-up of the three sets of experiments carried out. Specifically, in Table 1a is presented the basic experimental set up for the six cultivations of M. gaditana carried out in a glass greenhouse in which the effect of mode of cultivation (shown in column 7) on the biomass productivity and the carbon uptake rate was examined. In Table 1b, is presented the basic experimental set up for the four cultivations of M. gaditana carried out in a glass greenhouse in which the effect of cobalt on the biomass productivity and the lipid profile was studied. In Table 1c is presented the basic experimental set up for the five cultivations of M. gaditana carried out in a glass greenhouse in which the effect of molybdenum on the biomass productivity and the lipid profile was studied.
Table 1a. The basic experimental set up for the six cultivations of M. gaditana in a glass greenhouse.


Table 1b. The basic experimental set up for the four cultivations of M. gaditana in a glass greenhouse where the effect of Co was studied.
Table 1c. The basic experimental set up for the four cultivations of M. gaditana in a glass greenhouse where the effect of Μo was studied.
The microalgae species M. gaditana (SAG strain number 2.99) was obtained from the University of Göttingen and was cultivated in Brackish Water Medium (Sammlung von Algenkulturen der Universität Göttingen (SAG), Göttingen, Germany) (= 1/2 SWES) [24]. SAG 2007 is the protocol for the growth medium suggested by SAG [Sammlung von Algenkulturen (SAG)], which is the research center from which the strain was obtained.
In each experiment the culture medium was inoculated with a standard quantity of 50 mL of microalgae inoculum. The pH was measured with a pH meter (Consort C532 CONSOR, n.v. Turnhout Belgium, 2004) and was kept constant by the addition of HCl (J.T. Baker, 37%) or NaOH (Lach-Ner, s.r.o, Chech Republic., 99.37%) solution. Experiments were carried in cylindrical flasks of 35 cm height and 19 cm diameter and total volume of 10 L, which were filled up to 8 L with growth media. Air, in the form of bubbles, was introduced into the culture medium through perforated tubes placed at the bottom of each reactor. The air supply was the same in all reactors and was carried out at a rate of 300 L h−1 corresponding to 0.12 L CO2 h−1 and 65.7 L O2 h−1. The experiments were performed in a glass greenhouse so that all experiments-cultivations in each set were subjected to the same conditions of temperature, light intensity, orientation and ventilation. Therefore, in each set of the three independent sets of experiments, all the components-variables of the medium were the same and only the mode of cultivation, the Co and the Mo varied as shown in Tables 1a, 1b and 1c respectively. In the four mixotrophic cultivations the initial carbon concentration, C(0), was varied in order to study its effect on the cultivation. In the four mixotrophic and the heterotrophic cultivations the growth rate was monitored daily by measuring the remaining organic carbon in the growth media. The growth rate in the autotrophic cultivations where the effect of Co and Mo was studied was monitored daily using optical density measurements at 655 nm with the use of a spectroscopy UV/Vis instrument (Cintra 101 Model GBC, Melbourne, Australia). Absorbance of the microalgal solution was found to be highest at around 665 nm. A 680 nm wavelength is typically correlated with the maximum absorbance of chlorophyll α. However, other chlorophylls as well as dissolved substances may affect the wavelength of absorbance and give a small experimental error in the measurements [25,26]. The chlorophyll content of cells affects their optical properties, which alters the correlation between absorbance and dry weight [27]. However, the chlorophyll content of microalgae varies over the growth cycle and also depends on the growth conditions [28,29]. So, optical density measurement in this wavelength was used as an indication of biomass growth progress and as an indirect measure of the biomass weight content as a function of cultivation time. Biomass yield was measured at the end of cultivation period by measuring the dry algal biomass weight. Therefore, Equation (1) should give an approximate value of the specific growth coefficient in the exponential growth phase.
Three aliquots were collected daily from each culture and all measurements were carried out in triplicate. At the end of each experimental period, the total production of each culture was measured (in g L−1) after harvesting the biomass using centrifugation with a centrifuge (Consul 22, orto alresa, Alvarez Redondo S.A., Madrid, Spain, 2017) at 4000 rpm for 10 min and drying of the biomass at 40 °C in an air circulating oven (Binder BD115 (FD), Binder GmbH, Tullingen, Germany, 2012) until a constant weight was attained.
The specific growth rate in the exponential growth phase μexp, which is the slope of the growth rate curve in the exponential phase was calculated according to the relation:
where, α1 and α2 are the optical densities at the beginning and the end of exponential growth phase, at time t1 and t2, respectively.
The formulas used to calculate the biomass yield (Mb), and the biomass yield per g of organic carbon added (M’b) are given by the following formulas:
and
where,
Wb = weight of dry biomass obtained from the cultivation after centrifugation and drying;
NL = liters of growth medium in the cultivation;
Wc = g of atomic carbon added to the growth medium.
The total nitrogen (N) of microalgae was determined by Kjeldahl analysis (behr Labor-Technik, Germany), while the crude protein content was calculated based on the nitrogen to protein factor 4.78 as suggested by Lourenco et al. [30].
Fatty acid methyl esters (FAME) were prepared by acid catalysed transesterification. Extracted lipid sample containing 1 mg of total lipids and 0.1 mg heptadecanoic acid (17:0) (Sigma Chemical Company, St. Louis, USA) as internal standard was evaporated under a stream of nitrogen until dryness. Consecutively 2 mL of methylating agent was added containing sulphuric acid in methanol (1% H2SO4 (PanReac Applichem, Darmstadt, Germany) in methanol (for UHPLC supergradient) and 1 mL of toluene (Penta chemical unlimited, Prague, Czech Republic). Vials were flashed with nitrogen and dry incubated on a hot block at 50 °C for 16 h. Crude FAME were purified by thin layer chromatography (TLC) on 20 x 20 glass plate pre-coated with silica gel G (Merc silica gel 60) cm in isohexane: diethyl ether: acetic acid (90:10:1, v/v) and visualized by spraying lightly the edge of the plate with 1% (w/v) iodine in CH3Cl3 (Merck, Darmstadt, Germany). FAME were scraped from the plate and eluted with isohexane: diethyl ether (1:1, v/v). Purified FAME were re-dissolved in isohexane (95% for GC, Supelco- Sigma-Aldrich, Darmstadt, Germany) containing 0.05% BHT and stored under nitrogen at −80 °C. Separation and quantification of FAMEs was conducted by gas-liquid chromatography with a Perkin Elmer Clarus 680 coupled with a Col-Elite FAME Wax capillary column (30m x 0.25mm id, film thickness 0.25 μm) (PN N9316694, Perkin Elmer, Waltham, MA, USA). Hydrogen was the carrier gas with at constant flow rate of 1 mL/min. Injector temperature was set at 240 °C with a split ratio of 1: 10 at a total flow rate of 5 mL/min. The column oven was programmed from 60 °C to 190 °C for 5 min at a rate of 20 °C/min and from 190 °C to 240 °C at a rate of 5 °C/min. The final temperature was maintained for 20 min. Identification of individual FAMES were conducted by comparison to known standards (CL40.13093, FAME MIX 37, Sigma-Aldrich, St. Louis, Missouri, USA). Peak areas were quantified with reference to the peak area of 17:0 as an internal standard and chromatograms were analysed using total chrome software.
Data were tested for normality by Shapiro-Wilk’s and for homogeneity by Levene’s test and were transformed whenever required. Results of the nitrogenous substances, total proteins, total lipids and fatty acid profiles of of M. gaditana cultured in cultured at different concentrations of cobalt were subjected to independent T-test. Results of nitrogenous substances, total proteins, total lipids and fatty acid profiles of M. gaditana cultured in cultured at different concentrations of molybdenum were subjected to one-way analysis of variance (ANOVA) followed by Tukey’s post-hoc test to rank the groups using SPSS 29.0 (IBM SPSS Statistics). Differences were regarded as significant at P < 0.05.
Figure 1 shows the reduction of the organic carbon concentration vs. the cultivation time for the heterotrophic and the four mixotrophic cultivations.
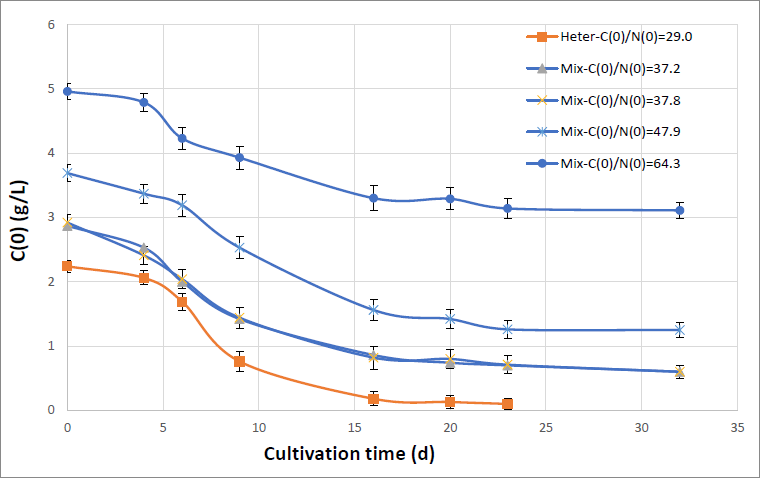
Figure 1. The carbon reduction vs. the cultivation time for the heterotrophic and the four mixotrophic cultivations for the initial carbon concentrations equal to 2.24, 2.87, 2.92, 3.69 and 4.96 g/L and for C(0)/N(0) ratios shown in the figure. Initial atomic nitrogen concentration is equal to 77.1 mg/L. Curves were drawn between data points for clarity. Data represent average means (n = 3) and bars standard deviation.
It is evident from Figure 1 that the cultivation time is strongly dependent on the initial carbon concentration and as C(0) increases so does the cultivation time. For the heterotrophic cultivation, within 15 days, 92% of the carbon has been utilized. For the mixotrophic cultivations after 32 days of cultivation 79%, 68% and 37% of the carbon has been utilized for C(0) equal to 2.92, 3.96 and 4.96 g/L (C(0)/N(0) = 37.8, 47.9 and 64.3) respectively. This substantially increased cultivation time required for the reduction of organic dissolved carbon (compared to the corresponding one for the heterotrophic cultivation) is probably due to the decreased carbon uptake rate because during the daylight hours in the mixotrophic cultivations the microalgal cells work via photosynthesis and therefore do not absorb dissolved organic carbon as efficiently. The organic carbon uptake rate was higher in the heterotrophic growth because during the day the microalgal cells via photosynthesis utilize CO2 as well.
Figure 2 shows the carbon uptake rate vs. the C(0)/N(0) ratio for the four mixotrophic cultivations of Table 1. The carbon uptake rate is defined as the average slope of the carbon vs. cultivation time curve for each of the heterotrophic and the four mixotrophic experiments. It is a measure of how fast carbon is being utilized by the microalgae.
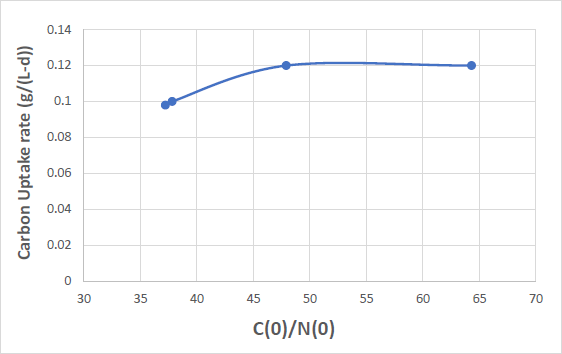
Figure 2. The carbon uptake rate vs. the C(0)/N(0) ratio for the four mixotrophic cultivations of Table 1. Curves were drawn through the data points for clarity. For comparison the carbon uptake rate for the purely heterotrophic cultivation with C(0)/N(0) = 29.0 is 0.14 g/(L-d).
From Figure 2 it is seen that carbon uptake initially increases and then above C(0) = 3.96 g/L (C(0)/N(0) = 47.9) it remains constant. For comparison the carbon uptake rate of the heterotrophic cultivation, although it showed a lower C(0) and a ratio C(0)/N(0) equal to 2.24 g/L and 29.0 respectively, is equal to 0.14 g/(L-d) higher by 40% than the 0.1 g/(L-d) for the mixotrophic cultivations with C(0) = 2.87 and 2.92 g/L and C(0)/N(0) = 37.2 and 37.8 respectively. As mentioned before, this may be attributed to the decreased carbon uptake rate for the mixotrophic cultivations because during the day the microalgal cells photosynthesize and therefore do not utilize dissolved organic carbon as efficiently. Therefore, the time necessary for the organic carbon to be utilized and the rate of carbon uptake, are influenced by both the mode of cultivation and the initial carbon to nitrogen ratio of the growth medium.
Table 2 shows the biomass yield and the biomass productivities of the six cultivations namely, the autotrophic, the heterotrophic and the four mixotrophic cultivations of M. gaditana. As noted in Table 2 the biomass yield differed in these cultivations. It is noted from Table 2, that in the mixotrophic cultivations, as the amount of carbon added to the growth medium increases, the biomass yield and the biomass productivity increase. The biomass yield can also be expressed as g/(L-per g of carbon added), i.e., as g of biomass per liter of growth medium per g of added carbon. The biomass yield per g of carbon added (line 2 in Table 2) is then equal to 1.1, 1.1 and 0.96 g/(L-g of C) for the mixotrophic cultivations with C(0)/N(0) = 37.2, 37.8 and 47.9 respectively and is reduced to 0.85 for the higher ratio of C(0)/N(0) = 64.3. For the heterotrophic growth for C(0)/N(0) = 29 the biomass yield as well as the biomass productivity are equal to 1.3 g/(L-g of C) and 145 mg/(L-d) respectively and are higher than the respective biomass yield and productivities of the mixotrophic cultivations. The autotrophic cultivation gave a biomass yield of 2.8 g/L. The productivity is higher for the heterotrophic growth because of the shorter cultivation period required. For the autotrophic growth the biomass productivity was 87.5 mg/(L-d), substantially lower compared to the heterotrophic and the mixotrophic cultivations.
Table 2. The biomass yield (Mb), the biomass productivity (Pb) and the biomass yield per g of organic carbon added in the growth medium (M’b) for the autotrophic, the heterotrophic and the four mixotrophic cultivations of Microchloropsis gaditana. Values represent means and ± standard deviation (n = 3).
From these experiments where the autotrophic, heterotrophic and mixotrophic growth modes are compared it is concluded that, with respect to the biomass productivity, (a) the heterotrophic growth is superior to the autotrophic growth, (b) the heterotrophic growth is also superior to the mixotrophic growth and (c) increasing the amount of organic carbon added to the mixotrophic growth experiments increases the biomass yield (g/L) as well the biomass productivity (g/(L-d)) but, decreases the biomass yield per gr of organic carbon added (g/(gC-L)).
Figure 3 illustrates the absorbance of the growth medium (with respect to the blank) vs. the cultivation time grown with different concentrations of Mo while, Figure 4 shows the corresponding absorbance of the growth medium for M. gaditana grown with different concentrations of Co. Figure 5 shows the specific growth coefficient in the exponential phase, μexp, vs. the concentrations of Mo, Co, derived from the data of Figures 3 and 4 using Equation (1). From Figures 3–5, in the wide range of concentration values studied, 595 times for Mo and 200 times for Co, Co seems to have the more pronounced effect on the growth of M. gaditana. It appears to be a strong inhibitor of algal growth even at relatively very low concentrations of 1 mg/L or higher. At 1 mg/L concentration of Co, algal growth is basically stalled. It should be mentioned that the concentration of 0.20 mg/L is the concentration of Co used in the standard growth medium [24]. This is evident from Figure 5 where the specific growth rate is basically zero (0.04 d−1) for a Co concentration of 1 mg/L.

Figure 3 The absorbance of the growth medium (with respect to the blank) vs. the cultivation time grown with different concentrations of Mo for the autotrophic growth of M. gaditana. Curves are drawn between data points for clarity. Data represent average means (n = 3). Standard deviation was within ±5% and is not shown with bars for clarity.
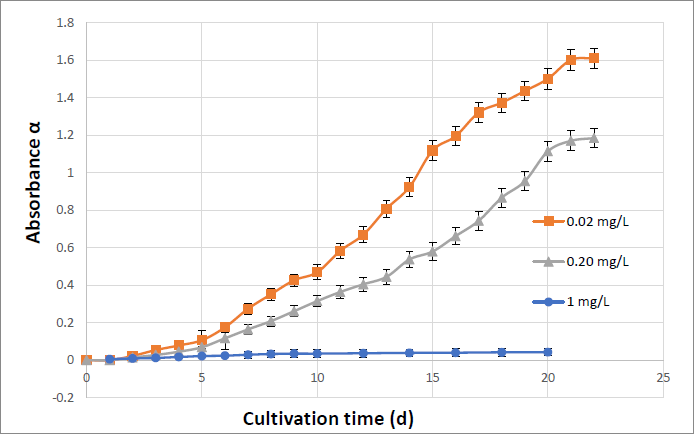
Figure 4 The absorbance of the growth medium (with respect to the blank) vs. the cultivation time grown with different concentrations of Co for the autotrophic growth of M. gaditana. Curves are drawn between data points for clarity. Data represent average means (n = 3) and bars standard deviation.

Figure 5 The specific growth coefficient in the exponential phase, μexp, vs. the concentrations of Mo, Co, derived from the data of Figures 3 and 4 and Equation (1).
Mo, although its concentration was varied by nearly 595 times, does not affect substantially the growth rate. The specific growth rate in the exponential phase (μexp) was maximum at 3.97 mg/L Mo concentration, which is the concentration used in the standard Brackish Medium. However, even at a very high Mo concentration, up to 238.2 mg/L, the μexp decreases from a maximum value of 0.23 d−1 to 0.20 d−1, only by 15%.
Table 3 shows the biomass of M. gaditana produced (on a dry basis) in g/L for the various concentrations of Mo and Co. Biomass production is highest at the high Mo concentration of 238.2 mg/L. From Figure 3, if the lag phase of about 4-5 days is excluded from the cultivation time, biomass productivities of M. gaditana range from a low of about 75 mg/(L-d) to a high of 117 mg/(L-d) as the concentration of Mo varies by 595 times. On the other hand, the addition of excess Co leads to a stall in microalgal growth. It is interesting to note (Figure 4) that although the concentration of Co in the standard growth Brackish Medium is 0.20 mg/L, its productivity at concentrations ten times lower, i.e., at 0.02 mg/L, increases from 68 mg/(L-d) to 115 mg/(L-d), an increase of almost 70%.
Table 3 The biomass of M. gaditana produced (on a dry basis) in g/L for the various concentrations of Mo and Co used in the cultivations. Values represent means and ± standard deviation (n = 3).
Tables 4 and 5 show the percent nitrogenous compounds, protein and lipid content of the treatments where Co and Mo were varied respectively. The microalgae biomass apart from crude proteins and crude lipids contains ash (minerals), carbohydrates and residual moisture. For aquafeeds, the algae biomasses are of great interest as protein and lipid sources and not as sources of minerals and carbohydrates. Specifically, the interest of M. gaditana for aquafeeds is stemming from the fact that this species is a known rich source of EPA. That is why this study focuses on the protein and lipid content as well as on the fatty acid profile.
Table 4 Total nitrogenous substances (% by dry weight), total proteins (% by dry weight) and total lipids of M. gaditana cultivated at different concentrations (mg/L) of Co.
Table 5 Total nitrogenous substances (% by dry weight), total proteins (% by dry weight) and total lipids of M. gaditana grown in different concentrations (mg/L) of Mo.
It is noted from Tables 4 and 5 that the lipid content is maximum for Co and Mo concentrations equal to 0.20 and 19.9 mg/L respectively. Co concentration is reported to affect the lipid content of the biomass. Specifically, in Chlorella vulgaris and Euglena oleoabundans at higher Co concentrations the lipid content of the biomass increased by 25% and 63% respectively [31], while in Dunaliella tertiolecta at low Co concentrations the lipids increased by 25% [32]. Specifically, in Chlorella vulgaris an increase in cobalt concentration from 0.10 mg/L (control) to 0.15 mg/L resulted in 25% increase in the lipid content [24]. In Dunaliella tertiolecta lipid content of the biomass increased by about 25% as the cobalt concentration decreased from 0.07 ng/L to 0.03 mg/L [32]. Also, in literature, the NC-MKM strain of Chlorella sp. showed a significant increase in lipid content, equal to 70.3%, with the addition of 0.006 mg/L of Mo [33]. Also, in another study the addition of Mo was found to increase the lipid content of C. vulgaris but had no effect on C. sorokiniana [34]. In contrast to C. vulgaris the species Dunaliella tertiolecta showed an increase in lipid content with Mo deprivation [32]. In general, the percent proteins in the biomass of M. gaditana is higher than the lipid content in all treatments.
Table 6 shows the fatty acid profile (as percent of total lipids) of the lipids extracted from the biomass of M. gaditana for the two treatments where Co concentrations were 0.02 and 0.20 mg/L. Figure 6 shows the histogram of the fatty acid profile with respect to their degree of saturation for Co.
Table 6 Fatty acid profile (% total fatty acids) of M. gaditana cultured at different concentrations (mg/L) of Co.

Figure 6 The histogram of the FA profile with respect to their degree of saturation for Co = 0.02 and 0.20 mg/L.
It is noted from Table 6 that fatty acids (FA) from C:12 up to C:24 are produced. Saturated fatty acids (SFA) range from C:12 to C:24, while monosaturated (MUFA) from C:16 to C:24 and polyunsaturated (PUFA) fatty acids range from C:18 to C:22. From Figure 6, it is noted that for both treatments, MUFA are predominant and comprise 38.95% and 43.7% of the total lipids for Co = 0.02 and 0.2 mg/L respectively. Substantial percentages of n-3 PUFA, and particularly of 20:5n-3, are also produced, equal to 26.62 and 19.45% for Co = 0.02 and 0.2 mg/L respectively. N-6 PUFA comprise a smaller percentage from 9.6% to 8% but a substantial percentage of SFA are produced, 24.8 and 24.6% respectively. The ratio of n-3 to n-6 is rather high, 2.8 and 2.4 respectively.
Table 7 shows the fatty acid profile (as percent of total lipids) of the lipids extracted from the biomass of M. gaditana for the five treatments where the Mo concentrations were varied from 0.40 to 238.2 mg/L. Figure 7 shows the histogram of the fatty acid profile with respect to their degree of saturation for Mo.
Table 7 Fatty acid profile (% total fatty acids) of M. gaditana cultured in cultured at different concentrations (mg/L) of Mo.
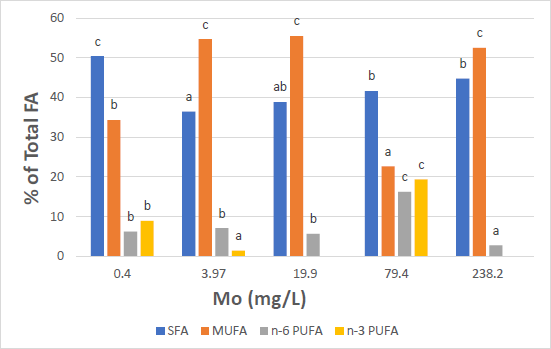
Figure 7 The histogram of the FA profile with respect to their degree of saturation for Mo.
From Figure 7 it is noted that for Mo concentrations equal to 3.97, 19.9 and 238.2 mg/L, MUFA are predominant and are equal to 54.7%, 55.5% and 52.5%, respectively. For the treatments where the Mo concentration is equal to 0.4 and 79.4 mg/L, SFA are predominant and are equal to 50.4% and 41.6% respectively. n-6 PUFA comprise a much smaller percentage ranging from a low of 2.8% to a high of 16.2%. Although substantial percentages of n-3 PUFA are also produced for the treatment where Co = 79.4 mg/L, no clear trend with respect to the Mo concentration is observed.
The effect of various micronutrients on the EPA content of M. gaditana was reported [35]. In that study it was found that the species cultivated in media which contained reduced concentrations of iron and zinc led to a decreased EPA content but on the other hand, cultivation in media that contained reduced concentrations of molybdenum, manganese and cobalt did not affect the EPA productivity. In another study, the effect of Co concentration on the growth rate of Tetraselmis subcordiformis and its lipid production was examined [29]. It was reported that the maximum lipid production was achieved using a concentration of Co in the growth medium equal to 0.001 mg L−1. The highest crude protein content (33.75 mg L−1) was observed with 0.001 mg L−1 Co. The highest and lowest lipid accumulation in T. subcordiformis was observed in 0.001 mg L−1 and 10 mg L−1 Co, respectively. Under cobalt deficient conditions, T. subcordiformis produced a large quantity of saturated fatty acids [36].
The effect of macro and of a variety of micronutrients on the total lipid content and the fatty acid profile of Scenedesmus obliquus was also studied [37]. The growth rate and biomass of S. obliquus ranged from 0.175 d−1 to 0.209 d−1 and 0.92 g L−1 to 1.79 g L−1, respectively. The highest percentage of total lipids and PUFA was 32% and 43.7% respectively. Sodium, iron, cobalt and molybdenum increased the growth rate, the total lipid content and the percentage of SFA of S. obliquus. Of the SFA, palmitic acid showed the greatest increase. The highest amount of PUFAs and oleic acid were related to potassium and magnesium and to a lesser extent to nitrogen and phosphorus. The highest amount of MUFAs, especially ALA was obtained with nitrogen starvation [37].
The effect of trace elements on the lipid productivity and fatty acid composition of M. oculata were studied [38]. The results showed that trace elements had a strong influence not only on the lipid productivity but also on the fatty acid composition. The addition of Fe+3, Zn+2, Mn+2, Mo+6, and EDTA and the deletion of Cu+2 and Co+2 increased the lipid productivity. The optimum concentrations of the trace elements in the culture medium, with respect to the control group, were 6 times of Fe+3 and EDTA, equal concentrations of Zn+2, Mn+2, and Mo+6 and a growth-optimum medium that has no Cu+2 or Co+2. Fe+3, Zn+2, Mn+2, Mo+6, and EDTA were found to be indispensable during the EPA formation of M. oculata [38].
The species M. gaditana can grow in a variety of modes. In mixotrophic and heterotrophic mode it absorbs and utilizes glycerol efficiently. The mode of cultivation of the microalgal species M. gaditana affects the kinetics of carbon reduction as well as the carbon uptake rate. Cultivation of M. gaditana proceeds fast in both heterotrophic and mixotrophic modes. The time it takes for the organic carbon to be utilized depends on the initial concentration of organic carbon used and it increases substantially as the C(0) increases. In the mixotrophic mode, as the amount of carbon added increases, the carbon uptake rate initially increases and then it becomes constant. Increasing the amount of organic carbon added to the mixotrophic growth experiments increases the biomass yield (g/L) as well the biomass productivity (g/(L-d)) but, decreases the biomass yield per g of organic carbon added (g/(gC-L)). The biomass productivity is higher in the heterotrophic growth compared to the mixotrophic and the autotrophic growth. Therefore, for mixotrophic cultivations the bioreactor is best operated in a semi-batch mode rather than in a batch mode. Co appears to inhibit growth in concentrations above 0.20 mg/L. When Co concentration is decreased, the biomass yield is increased and therefore biomass production is inversely proportional to the Co concentration. On the other hand, Mo concentration does not substantially affect the biomass yield. For Mo concentrations ranging from 0.40 to 238.2 mg/L, biomass production varied was 1.27 to 2.0 g/L, the maximum production was obtained for the highest Mo concentration. For both treatments with varying Co and Mo concentrations fatty acids from C:12 up to C:24 are produced. Substantial percentages of SFA are produced ranging from 24.6% to 24.8% for the Co treatments and from 36.44% to 50.41% for the Mo treatments. The lipid distribution showed that for most treatments, with varying concentrations of Co and Mo, MUFA prevailed while, substantial percentages of n-3 PUFA up to 26.6% and 19.4% of the total FA were obtained for the Co and Mo treatments respectively. Lipid contents of the biomass for the treatments were up to 8.18% and 16.67% for the Co and Mo treatments respectively.
Not applicable.
Not applicable.
The data that support the findings of this study are available from the corresponding author upon request.
The authors have declared that no competing interests exist.
This study was part of the project coded MIS 5045804 that has been co-financed by Greece and EU under the "Operational Programme Competitiveness, Entrepreneurship and Innovation - EPAnEK 2014-2020".
G. Papapolymerou: Conceptualization, data curation, formal analysis, investigation, methodology, project administration, resources, supervision, writing-original draft, writing-review& editing
M. N. Metsoviti: Conceptualization, data curation, formal analysis, investigation, methodology, resources, writing-original draft, writing-review& editing
I. T. Karapanagiotidis: Data curation, formal analysis, investigation, methodology, resources, validation, writing-original draft, software
N. Katsoulas: Conceptualization, formal analysis, data curation, software, methodology
E. Z. Gkalogianni: Formal analysis, data curation, validation
The following abbreviations are used in this manuscript:
| 1 | Mata TM, Martins MM, Caetano NS. Microalgae for biodiesel production and other applications: A review. Renew Sustain Ener Rev. 2010;14(1):217-232. [Google Scholar] [CrossRef] |
| 2 | Chojnacka K, Marquez-Rocha FJ. Kinetic and stoichiometric relationships of the energy and carbon metabolism in the culture of Microalgae. Biotechnology. 2004;3(1):21-34. [Google Scholar] [CrossRef] |
| 3 | Huang G, Chen F, Wei D, Zhang X, Chen G. Biodiesel production by microalgal biotechnology. Appl Energ. 2010;87(1):38-46. [Google Scholar] [CrossRef] |
| 4 |
Xiong W, Li X, Xiang J, Wu Q. High-density fermentation of microalga |
| 5 | FAO. Fishery and Aquaculture Statistics. Global aquaculture production 1950–2020 (FishStatJ) [Internet]. Rome: FAO Fisheries and Aquaculture Division; 2022 [cited 30 Mar 2023]. Available from: www.fao.org/fishery/en/statistics. |
| 6 |
Lubian LM, Montero O, Moreno-Garrido I, Huertas IE, Sobrino C, Gonzalez-Del Valle M, et al. |
| 7 | Huerlimann R, de Nys R, Heimann K. Growth, lipid content, productivity, and fatty acid composition of tropical microalgae for scale-up production. Biotechnol Bioeng. 2010;107:245-257. [Google Scholar] [CrossRef] |
| 8 | Bruland KW, Donat JR, Hutchins DA. Interactive influences of bioactive trace metals on biological production in oceanic waters. Limnol. Oceanogr. 1991;36:1555-1577. [Google Scholar] [CrossRef] |
| 9 |
Carvalho AP, Pontes I, Gaspar H, Malcata FX. Metabolic relationships between macro- and micronutrients, and the eicosapentaenoic acid and docosahexaenoic acid contents of |
| 10 | Sargent JR, Bell JG, McEvoy LA, Tocher DR, Estèvez A. Recent developments in the essential fatty acid nutrition of fish. Aquaculture. 1999;177(1-4):191-199. [Google Scholar] [CrossRef] |
| 11 | Turchini GM, Torstensen BE, Ng WK. Fish oil replacement in finfish nutrition. Rev Aquac. 2009;1(1):10-57. [Google Scholar] [CrossRef] |
| 12 |
Karapanagiotidis IT, Metsoviti MN, Gkalogianni EZ, Psofakis P, Asimaki A, Katsoulas N, Papapolymerou G, Zarkadas I. The effects of replacing fishmeal by |
| 13 | FAO. The State of World Fisheries and Aquaculture 2020. Sustainability in action [Internet]. Rome: FAO; 2020 [cited 27 July 2021]. Available from: https://doi.org/10.4060/ca9229e. |
| 14 |
Ma XN, Chen TP, Yang B, Liu J, Chen F. Lipid production from |
| 15 |
Chua ET, Schenk PM. A biorefinery for |
| 16 | Gong Y, Guo X, Wan X, Liang Z, Jiang M. Triacylglycerol accumulation and change in fatty acid content of four marine oleaginous microalgae under nutrient limitation and at different culture ages. J Basic Microbiol. 2013;53(1):29-36. [Google Scholar] [CrossRef] |
| 17 |
Xiao Y, Zhang J, Cui J, Feng Y, Cui Q. Metabolic profiles of |
| 18 |
Forján E, Garbayo I, Henriques M, Rocha J, Vega JM, Vílchez C. UV-A mediated modulation of photosynthetic efficiency, xanthophyll cycle and fatty acid production of |
| 19 |
Alboresi A, Perin G, Vitulo N, Diretto G, Block M, Jouhet J, Meneghesso A, Valle G, Giuliano G, Maréchal E, Morosinotto T. Light remodels lipid biosynthesis in |
| 20 | Das P, Lei W, Aziz SS, Obbard JP. Enhanced algae growth in both phototrophic and mixotrophic culture under blue light. Bioresour Technol. 2011;102(4):3883-3887. [Google Scholar] [CrossRef] |
| 21 |
Mitra M, Patidar SK, George B, Shah F, Mishra S. A euryhaline |
| 22 |
Matos ÂP, Feller R, Moecke EHS, Sant’Anna ES. Biomass, lipid productivities and fatty acids composition of marine |
| 23 |
Hulatt CJ, Wijffels RH, Bolla S, Kiron V. Production of Fatty Acids and Protein by |
| 24 | SAG. Sammlung von Algenkulturen der Universität Göttingen. Culture Collection of Algae, Abteilung Experimentelle Phykologie und Sammlung von Algenkulturen (EPSAG) [Internet]. Göttingen: Universität Göttingen; 2007 [cited 30 Mar 2023]. Available from: http://epsag.uni-goettingen.de. |
| 25 | Clesceri LS, Greenberg AE, Eaton AD. Standard Methods for the Examination of Water and Wastewater. 20th ed.. Washington D.C.: American Public Health Association; 1998. [Google Scholar] |
| 26 |
Scarponi P, Ghirardini AV, Bravi M, Cavinato C. Evaluation of |
| 27 | Griffiths MJ, Garcin C, van Hille RP, Harrison STL. Interference by pigment in the estimation of microalgal biomass concentration by optical density. J Microbiol Methods. 2011;85(2):119-123. [Google Scholar] [CrossRef] |
| 28 | Nicholls KH, Dillon PJ. An evaluation of phosphorus‐chlorophyll‐phytoplankton relationships for lakes. Int Rev gesamten Hydrobiol Hydrogr. 1978;63(2):141-154. [Google Scholar] [CrossRef] |
| 29 | da Silva Ferreira V, Sant’Anna C. Impact of culture conditions on the chlorophyll content of microalgae for biotechnological applications. World J Microbiol Biotechnol. 2017;33(1):1-8. [Google Scholar] [CrossRef] |
| 30 | Lourenço SO, Barbarino E, Lavín PL, Lanfer Marquez UM, Aidar E. Distribution of intracellular nitrogen in marine microalgae: Calculation of new nitrogen-to-protein conversion factors. Eur J Phycol. 2004;39(1):17-32. [Google Scholar] [CrossRef] |
| 31 |
Battah M, El-Ayoty Y, Abomohra A, El-Ghany S, Esmael A. Effect of Mn2+, Co2+ and H2O2 on biomass and lipids of the green microalga |
| 32 |
Chen M, Tang H, Ma H, Holland T, Ng K, Salley S. Effect of nutrients on growth and lipid accumulation in the green algae |
| 33 | Mandal MK, Saikia P, Chanu N, Chaurasia N. Modulation of lipid content and lipid profile by supplementation of iron, zinc, and molybdenum in indigenous microalgae. Environ Sci Pollut Res. 2019;26(20):20815-20828. [Google Scholar] [CrossRef] |
| 34 | Ghafari M, Rashidi B, Haznedaroglu B. Effects of macro and micronutrients on neutral lipid accumulation in oleaginous microalgae. Biofuels. 2018;9(2):147-156. [Google Scholar] [CrossRef] |
| 35 |
Camacho-Rodríguez J, Cerón-García MC, Fernández-Sevilla JM, Molina-Grima E. Genetic algorithm for the medium optimization of the microalga |
| 36 |
Eskandarnia H, Shamsaie Mehrgan M, Rajabi Islami H, Soltani M, Kamali A. Effect of different cobalt (CoCl2) concentrations on cellgrowth, some biochemical composition, and fatty acids profile of the marine microalga |
| 37 |
Darki BZ, Seyfabadi J, Fayazi S. Effect of nutrients on total lipid content and fatty acids profile of |
| 38 |
Dou X, Lu XH, Lu MZ, Yu KS, Xue R, Ji JB. The Effects of Trace Elements on the Lipid Productivity and Fatty Acid Composition of |

![]()
Copyright © 2026 Pivot Science Publications Corp. - unless otherwise stated | Terms and Conditions | Privacy Policy


