
Green Energy and Sustainability ISSN 2771-1641
Green Energy and Sustainability 2022;2(2):0004 | https://doi.org/10.47248/ges2202020004
Original Research Open Access
Simulation and analysis of three, solar assisted, ground source heat pump systems
Georgios Aspetakis
 ,
Nikolaos Andritsos
,
Nikolaos Andritsos
Correspondence: Georgios Aspetakis
Academic Editor(s): Thomas Kotsopoulos, Georgios Martinopoulos, Giorgos Panaras
Received: Sep 29, 2021 | Accepted: Jan 27, 2022 | Published: Apr 6, 2022
This article belongs to the Special Issue Selected Papers from the 12th National Conference of IHT
© 2022 by the author(s). This is an Open Access article distributed under the terms of the Creative Commons License Attribution 4.0 International (CC BY 4.0), which permits unrestricted use, distribution, and reproduction in any medium or format, provided the original work is correctly credited.
Cite this article: Aspetakis G, Andritsos N. Simulation and analysis of three, solar assisted, ground source heat pump systems. Green Energy Sustain 2022; 2(2):0004. https://doi.org/10.47248/ges2202020004
The use of Ground Source Heat Pump (GSHP) systems is promising in reducing the energy consumption in the households and services sector, which accounts for almost 40% of the total energy consumption in Europe and in Northern America. There is an increasing interest in combining such earth energy systems with solar energy. In this study, three Solar Assisted Ground Source Heat Pump configurations comprised of Flat-Plate (FPC), Photovoltaic (PV) and hybrid Photovoltaic/Thermal (PV/T) collectors are investigated aiming at upgrading an existing GSHP system installed in a university building complex at in Volos, Greece. These systems were simulated with the dynamic system simulation tool TRNSYS and were assessed on energy performance and on an economic and an environmental basis. Results of the analysis showed that the PV system is the best option due to its substantial energy savings and to the lower cost compared to the PV/T system.
KeywordsSAGSHP, hybrid systems, energy saving, system simulation, emissions reduction
According to the European Commission (EC), the sector of households and services accounts for more than 40% of total final energy consumption and 36% of greenhouse gases (GHG) emissions in the EU Member States. By improving the energy efficiency of buildings, a 5% reduction in energy consumption and subsequently in GHG emissions can be achieved [1]. Energy saving is the most cost-effective approach in that direction [2]. The Directive on the Energy Performance of Buildings (2018/844/EU) requires that by the end of 2020 all new buildings must attain nearly zero energy building (NZEB) status. Their energy demand should be covered almost completely from renewable energy sources (RES), including sources produced on-site or nearby. Hot water production in domestic homes amounts up to 66% of the building’s energy consumption while cooling demands increase each year [3]. Integrating renewable energy sources to the heating and cooling of buildings can diminish the consumption of fossil fuels, paving the road for complete decarbonization of the sector. By the end of 2018, RES covered 19.7% of the total heating/cooling energy demand in buildings in the EU [4]. Solar and shallow geothermal energy constitute easily accessible RES that can contribute to the cooling/heating of buildings with relatively simple devices, like heat pumps. In countries like Greece, solar energy can offer many advantages, given the high solar radiation potential of the region. Ground Source Heat Pumps (GSHPs) systems which, can be used almost everywhere, are characterized by high Coefficient of Performance (COP) and low operating costs.
Solar Assisted Ground Source Heat Pumps (SAGSHPs) combine these energy sources further, reducing primary energy consumption and emissions thus creating sustainable and cost-friendly systems. Solar energy either directly contributes to the heat flow from the ground source or generates electricity which powers the GSHP. SAGSHPs have been studied extensively the past 20 years [5, 6, 7]. Such configurations seem ideal for regions in the EU with high potential for solar energy utilization, like Greece, which boasts an average prospective generation of 1600 kWh/m2 annually [8]. By the end of 2019, the share of photovoltaics in the total electricity generation in Greece accounted about 7% [9]. The aim of this paper is to examine the possibility of upgrading an existing open-loop ground source heat pump system (which started operating at the end of 2021) using solar energy in the form of hot water and/or electricity.
Three configurations are simulated in TRNSYS in order to assess the potential of converting a typical open-loop GSHP system to a SAGSHP one. These systems are considered as upgrades to the heating/cooling equipment currently installed in two buildings of the University of Thessaly. The buildings investigated are located in Volos, Greece and will house the Department of Electrical and Computer Engineering. The covered area of the two, 4 storey buildings is 2644 m2.
Two water-to-water heat pumps have been installed drawing underground brackish water located a few tens of meters below the surface. These are CLINT CWW/K/302P and CLINT CWW/K/WP 393P with nominal heating/cooling capacity of 121/97.2 kW and 159/130 kW respectively. The groundwater has an average temperature of 17.1 °C throughout the year. The buildings have a rooftop area of 400 m2, suitable for the installation of solar collectors. For all simulations a timestep of 3 min was utilized for a period of 8760 hours. Three configurations were simulated for each GSHP configuration. Radiation data and weather conditions for the location were obtained from the PVGIS database, developed by the Joint Research Center of the EC [10]. The data was in typical meteorological year TMY file format which contains hourly values for irradiation, temperature, humidity, wind speed etc. The technical manual of the heat pumps provided data about heat flows, consumption and water draw. With heating and cooling control schemes, the temperature difference between the Outlet load and Inlet load of the HP is always kept at 5 °C. The vast majority of university buildings in Greece need heating and cooling for about 10 months (no classes in July and August). They usually operate five days a week, for a maximum of 13 hours a day (8:00 to 21:00). The heating season is between November 1st (7320 hrs.) and 15th of April and cooling is from May 15th (3240 hrs.) till September 15th (6192 hrs.). The main TRNSYS components (Types) utilized in the simulations are listed in Table 1. The three configurations in TRNSYS are presented in Figures 1, 2 and 3.


Figure 1 Screenshot of the layout of the FPC system from the Deck view of TRNSYS.
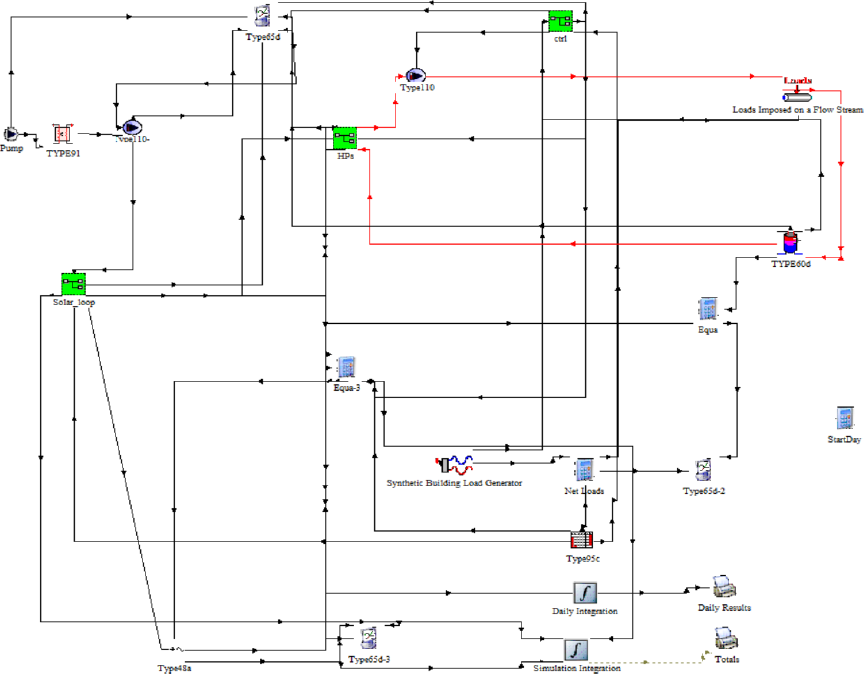
Figure 2 Screenshot of the layout of the PV system from the Deck view of TRNSYS.
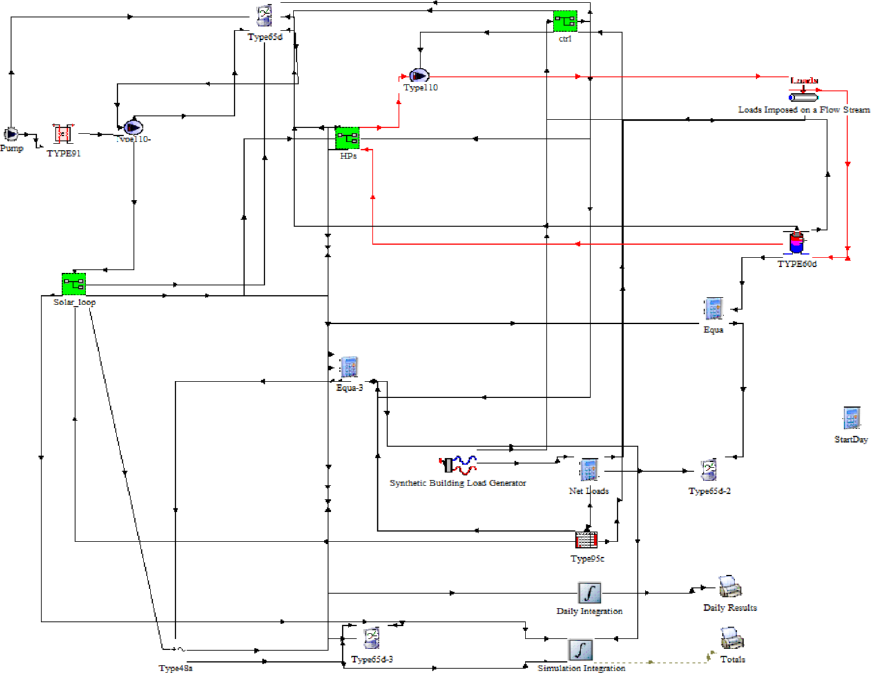
Figure 3 Screenshot of the layout of the PV/T system from the Deck view of TRNSYS.
Table 1 Main TRNSYS components utilized.

The following procedure applies for all the systems. The load profile is generated by the Synthetic Building Load Generator component. The next component, Type 682, imposes the generated heating/cooling loads upon a liquid stream. To simulate the water in the piping network, a storage tank was utilized, the temperature of which changes depending on the output of the load imposing component. The total water volume has been set to 2 m3. The flow is then directed to the GSHP, simulated by Type 668, which heats/cools the water flow according to the control scheme set by the differential controller, Type 2. In the heating season the temperature of the water is kept at 45 +/- 1 °C and in the cooling season at 7 +/- 1 °C. To close the loop, the output of the heat pump is used as input to the first component. A Holiday Calculator was added to regulate on which dates and hours the control signals can go through. The values of the Parameters of all the components are listed in Table 2.
Table 2 Parameter values of all simulations.
Flat Plate Collectors (FPC) heat the groundwater before it enters the heat pump thus achieving higher COP leading to lower electricity consumption. FPCs are connected with a storage tank containing heated water. When the tank temperature reaches 25 °C a pump turns on and circulates the water through a heat exchanger which heats the groundwater flow before it enters the HP. The FPC simulated is the collector “Phaethon” of Sonne Aktion Ltd. The National Centre for Scientific Research “Demokritos” tested the performance of the selected commercial solar collector according to Standard ISO 9806:2013. The report is available from the solar collector manufacturer. Optimal slope for the collectors was found to be 45°, with azimuth set to zero, after tests were performed. Likewise, numerous tests were performed regarding the volume of the storage tank and no discernible differences were found for volumes larger than 1 m3. The pump circulating water from the collectors to the storage tank turns on only when the incident radiation exceeds 100 W/m2. This mode is restricted to the heating season only. The rest of the year domestic hot water is produced by the FPCs.
The instantaneous efficiency of a collector operating under steady conditions, which is calculated by the solar collector component, is defined as:
where Q is the usable energy of collector, Ac is the collector area and IT is the solar radiation intensit, m the mass flow of fluid being heated, ti the entering temperature of the fluid and to the leaving temperature. The Hottel-Whillier-Bliss equation, expressing the thermal performance of a collector under steady state, is written as [11]:
In Equation (2), UL is the overall heat loss coefficient, tp is the absorber plate temperature, ta is the ambient air temperature and (ατ) is the effective absorbtance-transmittance product. Thus,
After some considerations a general form for instantaneous efficiency can be written as [11]:
where η0, α1, and α2 are constants of the solar collector considered and is the average of the fluid inlet and outlet temperatures.
In this system PVs are installed on the rooftops to provide electricity to the GSHPs. By covering partially or even fully the energy demand of the GSHPs a significant reduction in emissions and operating costs is achieved. Due to the mismatch of energy generation and demand, a net metering scheme is implemented. Net-metering allows energy producers to cover a substantial part of their electricity consumption, while utilizing the national power grid as an indirect energy storage for the green energy produced. When the power generation is insufficient the grid supplies the energy needed. Energy is provided to the grid when there is not any need for heating/cooling. Consumption fees and generation gains are offset in the end of the year. Legislation in Greece concerning net metering, states that for private or public legal entities seeking to install PVs that benefit the public, the power installed can reach up to 100% of the total consumption, otherwise only up to 50% is allowed. The panels simulated are the DualSun Flash 310M. DualSun also manufactures hybrid collectors with the same photovoltaic panel. This way a reasonable comparison can be made concerning the thermal energy generation of the hybrid model.
Type 94 calculates PV current and voltage values from manufactures’ catalog data. The current-voltage equation is:
where q is electron charge constant, k is the Boltzmann constant and Tc the module temperature, Rs and γ constants. The photocurrent IL is:
The reference incident radiation Gref can be given as a component parameter. It is nearly always defined as 1000 W/m2. The diode reverse saturation current Io is a function of temperature:
The current is implicitly calculated by the respective equations, as a voltage function. Having calculated photocurrent and diode reverse saturation current, Newton’s method is employed to calculate the PV current. Maximum power current (Imp) and voltage (Vmp) of the IV curve are calculated as well.
In this system the collectors installed generate electrical as well as thermal energy. The operation of this system is essentially the combination of the two former systems. The same parameters are used regarding the net metering scheme and the storage tank. In cooling season, when the temperature of the water in the storage tank reaches 45 °C, its content is discharged (for DHW etc.) and replaced with 23 °C water from the supply network. The goal is to cool the backside of the PV panels in order to increase their efficiency by 5% to 15%. The collector simulated is the model DualSun Spring 310M.
Component 50 adds a PV module to the standard flat-plate collector. It simulates a hybrid collector utilizing the work of Florschuetz for FPCs operated at peak power [12]. The component makes use of the I-V curves described above in the PV section. The useful heat gain is given by:
The same equation is employed in the flat plate collector component with the addition of a thermal efficiency factor FR. The electrical output is written as:
where η is the actual or reference efficiency of the photovoltaic modules and β is the power temperature coefficient. In this component Mode 1 is employed: the thermal loss coefficient of the collector is constant and given as a parameter.
All the examined configurations are compared to each other in terms of total consumption, power supplied from the grid and total emissions. Only the energy behavior of the 302-P heat pump is presented here, since the energy profiles of the two heat pumps are almost identical. For the FPC configuration simulations show that 60 m2 solar collector area can increase the average COP by 5%. Solar collector sizes larger than that increase the COP at a significantly reduced rate due to the thermal efficiency drop. This is due to the higher fluid temperatures flowing through the collectors, thereby reducing the heat transfer rate between the FPC absorbing surface and the fluid. For PV/Ts, the COP increases minimally even for large solar collector area as a result of a lower absorbance-transmittance product. 50 m2 of collectors hardly improve the average COP by 1%. Figure 4 illustrates the total energy consumption as a function of the total solar collector area simulated for all the systems. The FPC system appears to have the lowest total consumption, with a difference of up to 800 kWh. At a first glance from this figure it may be inferred that that FPC is the most energy efficient system, however further discussion will prove the contrary.
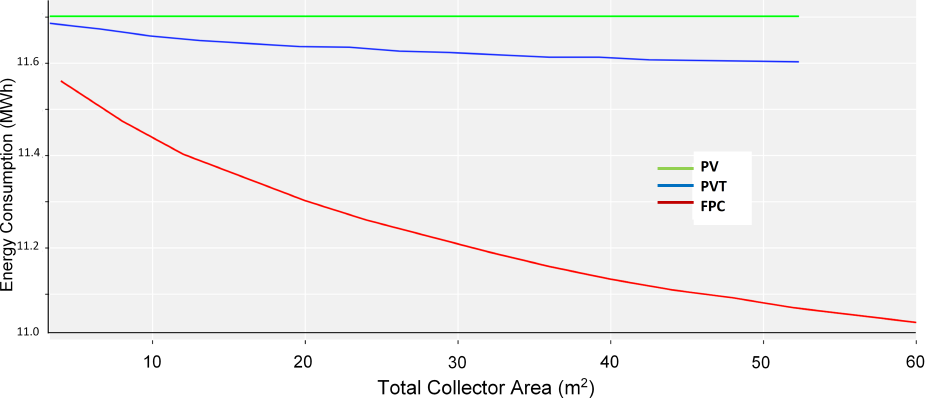
Figure 4 Total energy consumption as a function of total solar collector area.
The energy consumption from the grid for varying solar field area values is shown in Figure 5. It becomes immediately clear that the FPC system consumes significantly more energy from the grid compared to the other systems despite its low total energy consumption. The PV and PV/T systems display nearly identical behavior, with the latter having minimally lower consumption due to the slightly higher COP caused the by hot water production. These systems can save up to 1.5 MWh annually compared to the FPC system, and 2 MWh to the conventional system currently installed.
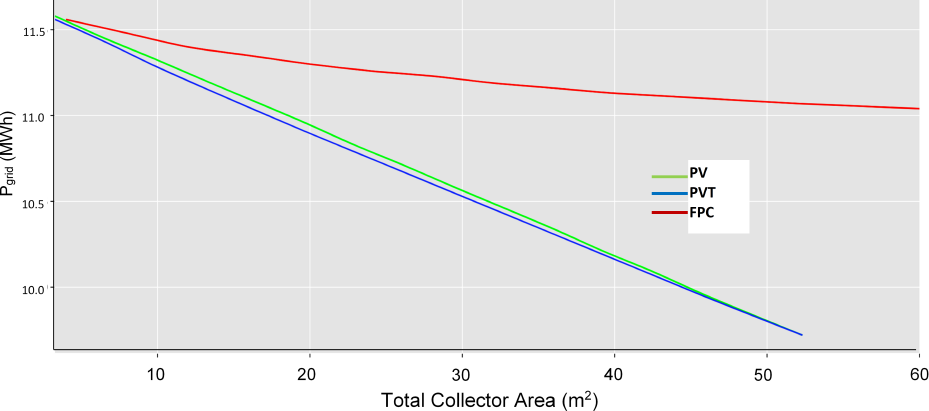
Figure 5 Consumption of grid electricity for varying collector area.
A 36 m2 solar collector area is investigated next. This constitutes the optimal total collector area value economically for PVs and PV/Ts as discussed below. In Figure 6 the total and grid-provided energy are shown for all 3 systems with 36 m2 solar collector area. The PV and PV/T systems consume more energy in total but the energy drawn from the grid is much lower. To investigate whether more FPCs could offset the difference, systems up to 120 m2 were simulated, yet they still could not beat the performance of the 36 m2 PV and PV/T systems. Figure 7 illustrates the grid consumption profiles of the systems for a year. A considerable difference is detected in June, which is caused by the increased consumption of the FPC system in general. This is due to the fact that the system cannot contribute to the cooling of the building. The addition of a hot water chiller in combination with more collectors (>100 m2) could offset this difference, but it would drive up the cost and the complexity of the system.
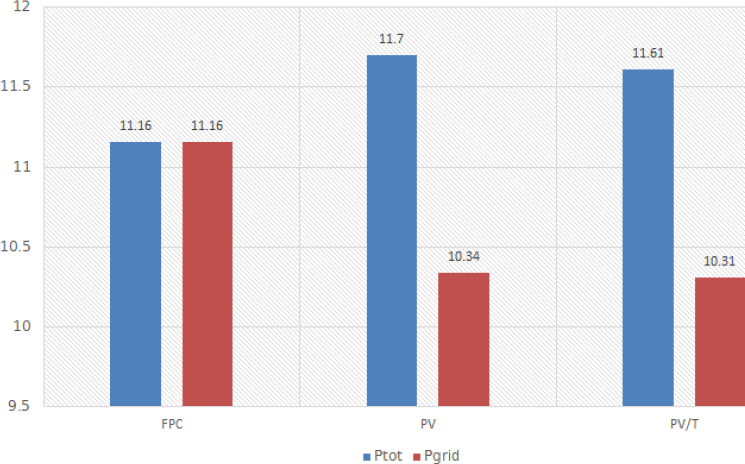
Figure 6 Comparison of total and grid consumption for a 36 m2 solar field.
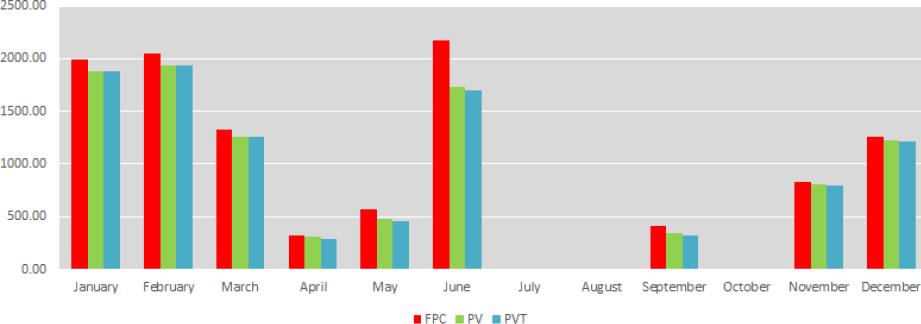
Figure 7 Monthly grid consumption profile for a 36 m2 solar field.
In the previous analysis, the energy generated when there are no heating/cooling loads present or simply when the department is closed, has not been included in the calculations. Concerning the GHG emissions of the systems, both the reduction of the energy supplied to the GSHP and the energy supplied to the grid have been accounted for, since the latter, wherever it is utilized, remains a RES generated energy quantity. Negative values can therefore be observed, implying that the SAGSHP system not only can achieve a zero carbon footprint, but can even reduce emissions regionally, by supplying power to the grid for other consumers. The CO2 per kWh of electricity generated in Greece was estimated in 2017 at 850 g/kWh [13] (the total impact of all GHG emissions is included). The emissions of the three systems can be viewed in Figure 8. PV and PV/T systems drastically reduce emissions, whereas FPCs have a minimal effect.
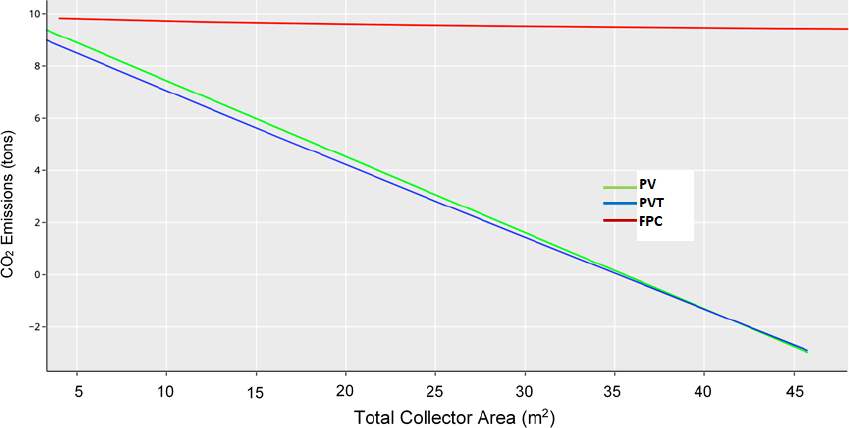
Figure 8 Carbon Dioxide emissions as a function of total collector area.
A simple economic analysis was carried out, considering that the total cost comprises of the initial capital and operating cost. The influence of workforce, installation and maintenance were not taken into account as they would be the same for such similar systems. The total cost for the three configuration are:
After surveying the Greek market, average prices of of various components are presented in Table 3. PV/Ts have not yet penetrated into the mainstream greek market so the average value of the panels was taken from a survey of all available PV/Ts in Europe by de Keizer et al. [14] as 300 € per m2. The operational cost is the electricity cost by the power consumption of the SAGSHPs. In Greece, educational institutions belong to the bill rate group for professionals and businesses. As of 2020, the average cost of power consumption was 0.14 €/kWh [15]. The life cycle of 20 years for the SAGSHP systems and a discount factor of 4% has been assumed. Thus the cost of operation after 20 years is:
where r the discount rate and n the life cycle in years.
Table 3 Average prices of several components considered in this work.
Figure 9 presents the total cost of the systems for a period of 20 years for various solar collector sizes. The cost of the FPC is high, surpassing even the cost of the non-solar configuration. PV has the lowest cost overall, with quite a significant difference to the configuration of PV/Ts. This is attributed to the almost identical electrical power output of the two systems but the PV has a lower cost per panel. This is unexpected as well, as one would assume that the PV/T is more efficient, in terms of both increasing the COP and generating more power. This is true, but as noted before, the energy savings caused by the higher COP values and the higher power output were minimal and not enough to offset the difference in the capital cost. The rise of the costs for the PV and PV/T systems is due to the fact that in the net metering scheme, power provided to the grid that exceeds the net balance agreed upon, is not counted for and cannot be sold.
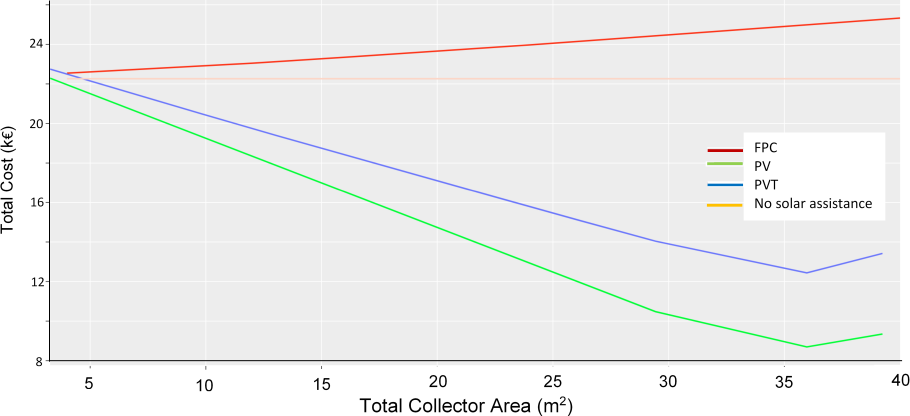
Figure 9 Total cost for a period of 20 years as a function of total solar collector area.
In this study, the year-round simulation of three solar assisted ground source heat pump systems was accomplished using TRNSYS software. The three configurations consist of a GSHP system coupled with a Flat Plate Collector, a Photovoltaic system and hybrid Photovoltaic/Thermal solar collector system. The main goal of this study was to evaluate the energy, economic and environmental performance of the three configurations in order to reduce the carbon footprint of an existing open loop GSHP system in a university building in Volos, Greece and to demonstrate the merits of each configuration. The main points of this study are summarized as follows:
-The energy analysis indicates that the PV and PV/T systems perform nearly identically and outperform the FPC system regarding energy consumption from the grid and carbon dioxide emissions.
-The economic evaluation of the systems for a life cycle of 20 years indicates that the PV configuration is the most viable option, due to its low cost per panel and high electricity generation. Thus, the optimal configuration is that of the GSHPs coupled to PVs, due to its excellent combination of energy performance and reduced emissions with the lowest cost possible.
-Finally, Solar Assisted Ground Source Heat Pump systems are very promising in decarbonizing the residential sector in Greece with respect to heating and cooling.
Not applicable.
Meteorological and Radiation Data: PVGIS Database
Heat Pumps, CWW/K/WP 302P and 393P: CLINT
FPC: Demokritos Solar Lab
PV and PV/T: DualSun
Not applicable
The authors have declared that no competing interests exist.
G. Aspetakis: Conceptualization, Investigation, Writing.
N. Andritsos: Conceptualization, Supervision
| 1. | European Commission. New Rules for Greener and Smarter Buildings Will Increase the Quality of Life for All Europeans, Directive (2018/844/EU); 2019 [cited 2021 Sep 16]. Available from: https://ec.europa.eu. |
| 2. | Prindle W. Energy Efficiency as a Low-Cost Resource for Achieving Carbon Emissions Reductions: Environmental Protection Agency; 2009 [cited 2021 Sep 16]. Available from: http://www.epa.gov/eeactionplan. |
| 3. | Rousselot M. Energy efficiency trends in buildings: European Union; 2018 [cited Sep 2020]. Available from: https://www.odyssee-mure.eu. |
| 4. | Eurostat. SHARES Data. European Commission. 2020. [Google Scholar] |
| 5. | Nouri G, Noorollahi Y, Yousefi H. Solar assisted ground source heat pump systems – A review. Appl. Therm. Eng. 2019;163:114351. [Google Scholar] [CrossRef] |
| 6. | Yao J, Wenjie L, Zhang L, Tian B, Dai Y, Huang M. Performance analysis of a residential heating system using borehole heat exchanger coupled with solar assisted PV/T heat pump. Renew. Energ. 2020;160:160-175. [Google Scholar] [CrossRef] |
| 7. | He Y, Bu X. Performance of Hybrid Single Well Enhanced Geothermal System and Solar Energy for Buildings Heating. Energies. 2020;13:2473. [Google Scholar] [CrossRef] |
| 8. | Kouremenos DA, Antonopoulos KA, Domazakis ES. Solar radiation correlations for the Athens, Greece, area. Sol Energy. 1985;35(3):259-269. [Google Scholar] [CrossRef] |
| 9. | HELAPCO. Statistics of the Photovoltaic market for 2019; 2020 [cited 2021 Sep 16]. Available from: (in Greek) https://helapco.gr/. |
| 10. | Joint Research Lab. PVGIS Database and Resource map: European Union. [cited 2021 Sep 16]. Available from: https://re.jrc.ec.europa.eu/pvg_tools/en. |
| 11. | ASHRAE Refrigerating and Air–Conditioning Engineers. ASHRAE Handbook, HVAC Applications. Atlanta: American Society of Heating; 2015. [Google Scholar] |
| 12. | Florschuetz LW. Extension of the Hottel-Whillier model to the analysis of combined photovoltaic/thermal flat plate collectors. Sol Energy. 1979;22(4):361-366. [Google Scholar] [CrossRef] |
| 13. | Technical Chamber of Greece. Regulation for Energy Efficiency in Buildings. [cited 2021 Sep 16]. Available from: https://ypen.gov.gr/energeia/energeiaki-exoikonomisi/ktiria/kenak/ (in Greek). |
| 14. | de Keizer C, Bottse J, de Jong M, Folkerts W. An Overview of PVT Modules on the European Market and the Barriers and Opportunities for the Dutch Market. [Google Scholar] [CrossRef] |
| 15. | Public Power Corporation in Greece. Price list for low voltage electricity. [cited 2021 Sep 16]. Available from: https://www.dei.gr/Documents/xt.tim.1.7.08.pdf (in Greek). |

![]()
Copyright © 2025 Pivot Science Publications Corp. - unless otherwise stated | Terms and Conditions | Privacy Policy


