
Green Energy and Sustainability ISSN 2771-1641
Green Energy and Sustainability 2022;2(1):0003 | https://doi.org/10.47248/ges2202010003
Original Research Open Access
Integration of a solar-powered absorption chiller for performance enhancement of a supermarket CO2 refrigeration plant
Evangelos Syngounas

 ,
Dimitrios Tsimpoukis
,
Maria K. Koukou
,
Michail Gr. Vrachopoulos
,
Dimitrios Tsimpoukis
,
Maria K. Koukou
,
Michail Gr. Vrachopoulos
Correspondence: Evangelos Syngounas
Academic Editor(s): Thomas Kotsopoulos, Georgios Martinopoulos, Giorgos Panaras
Received: Sep 29, 2021 | Accepted: Dec 20, 2021 | Published: Jan 20, 2022
This article belongs to the Special Issue Selected Papers from the 12th National Conference of IHT
© 2022 by the author(s). This is an Open Access article distributed under the terms of the Creative Commons License Attribution 4.0 International (CC BY 4.0), which permits unrestricted use, distribution, and reproduction in any medium or format, provided the original work is correctly credited.
Cite this article: Syngounas E, Tsimpoukis D, Koukou M, Vrachopoulos M. Integration of a solar-powered absorption chiller for performance enhancement of a supermarket CO2 refrigeration plant. Green Energy Sustain. 2022; 2(1):0003. https://doi.org/10.47248/ges2202010003
CO2 refrigeration configurations are the most viable solution for commercial refrigeration plants, which are however accompanied with energy challenges due to their low energy efficiency when operating under high ambient temperatures. This study examines the coupling of a CO2 booster system with a solar absorption chiller, used to sub-cool the CO2 of the main cycle. The refrigeration system under study is projected to cover the cooling requirements of a supermarket refrigeration plant with an installed capacity of 80 kWR for the medium and 20 kWR for the low-temperature circuit, in the region of Athens, Greece. The investigated process involves utilization of an absorption chiller module with 60 kWR of cooling capacity working with a LiBr-H20 pair powered by heat produced in fifty evacuated-tube solar collectors with a total collecting area of 115 m2. The energy performance analysis was based on validated numerical models developed in MATLAB using the CoolProp library. Through parametric analysis the coefficient of performance (COP) of the proposed topology was compared to the COP of a conventional booster system under constant low (450 W/m2) and high (800 W/m2) incident solar radiation for the temperature range 1–40 °C, resulting in maximum COP increments of 26.44% and 47.34% respectively. Performance simulation on an annualized basis was also conducted, by using the average hourly values of ambient temperature and solar radiation for every month of the year. The results showed that in comparison to the conventional booster system, the sub-cooling rates achieved a maximum increment of COP of 47.48% hourly and 16.36% monthly for August which is the warmest month of the year. Annual electricity consumption decreased by 8.93%, resulting in an energy savings of 30.19 MWh/year.
KeywordsCO2 refrigeration, absorption technology, solar energy, energy efficiency, commercial refrigeration
Significant research interest has been focused in recent years on supermarkets, since they are one of the most energy-intensive types of commercial building and their energy consumption accounts for more than 4% of the electricity used worldwide. The largest part of the power consumption in supermarkets (60%–70%) is linked to the refrigeration plants’ daily operation to maintain cooling or freezing conditions in the cabinets and/or cold-rooms of the stores [1]. Due to new environmental regulations, such as the ‘F-gas regulation’ enacted by the EU commission, the former most commonly used hydrofluorocarbon refrigerants (HFCs) in the global industry and market, have been replaced by carbon dioxide (CO2), which is the most sustainable alternative refrigerant for supermarket refrigeration systems [2].
Carbon dioxide refrigerant (R744) is one of the first substances ever used as refrigerants, since its employment in refrigeration sector can be traced back to 1930. R744 was introduced again in modern refrigeration systems by Prof. Lorentzen in 1994 [3]. Today, R744 has emerged as one of the frontrunners to be the refrigerant of the future, since it has excellent thermophysical properties, a low viscosity and high thermal conductivity. At the same time, it is environmentally friendly, being a natural refrigerant which has zero impact on the ozone layer (ODP = 0) and a minimal impact on global warming potential (GWP = 1) [4]. However, CO2 utilization in refrigeration configuration is mainly linked with lower energy efficiency rates, compared to the most commonly used HFCs refrigerants. More precisely, due to its low critical point (~31 °C), the operation in ambient temperatures above ~27 °C enters the supercritical area above the critical point, in which refrigerant is all in vapor state and cannot be condensed. The throttling process needed to take place to convert refrigerant back to liquid state, is accompanied by irreversibility and high exergy destruction figures [5]. Refrigeration systems working both in subcritical and supercritical areas are referred to as transcritical and, at least in their conventional form, they have a lower energy efficiency than HFC systems, especially for operation in the warmer countries of southern Europe, like Greece.
During recent years, CO2 refrigeration systems have created significant scientific interest, since many different topologies have been examined in order to reach equal or better energy performance than corresponding conventional HFC arrangements [6,7]. The most important types include integration of a parallel (auxiliary) compressor for mechanical sub-cooling of CO2 on the high pressure side, the operation of evaporators with liquid overfeeding, plus the use of ejector modules [8–11]. Investigation of the aforementioned energy-saving arrangements showed significant reduction in power consumption, at both the theoretical and experimental levels [12]. However, most of these solutions increase system complexity and capital investment cost for the refrigeration systems into which they are integrated [13]. The latter seems to be the reason for the small percentage of new commercial CO2 refrigeration plants, since retail companies still prefer to invest in lower GWP HFC alternatives, even though environmental policies totally ban them from 2030 onwards.
Renewable energy sources (RES) such as solar and geothermal, which are abundant in southern Europe and especially in Greece, can counterbalance the low energy efficiency of CO2 refrigeration systems, by exploiting their promising renewable energy potential. In fact, many studies focused on the integration of solar energy into CO2 cooling arrangements [14,15]. The results showed more than 50% enhancement of coefficient of performance (COP) in some cases. The heat produced in solar arrangements is most commonly integrated in the cooling system using sorption configurations. More precisely, absorption or adsorption chillers exploit heat to produce sub-cooled CO2 in the main cycle. The most mature sorption configurations used in solar cooling, are the absorption chillers (ACH) which have had widespread application worldwide in recent decades because of their high performance efficiencies [16,17]. Single stage absorption chillers using LiBr-H2O as a working pair are the most commonly used in solar thermal units [18]. In these configurations, solar heat produced in solar collectors is transferred to the ACH generator heat exchanger, so as to produce cooling in the ACH evaporator, respectively. Theoretical investigations of this concept showed significant improvement, as the calculated COP increased more than 40% during the summer operation period, compared to the COP of the corresponding conventional topology [14–19]. However, to the authors’ knowledge, there has been no actual implementation of the described solution in practice, plus there are negligible experimental data on the described topology in the international literature.
The current study aims to investigate the use of solar energy to increase performance indices for CO2 refrigeration configurations, through the theoretical investigation of a solar driven absorption chiller coupled to a supermarket refrigeration system. The heat absorbed in the absorption chiller evaporator sub-cools the CO2 of the booster cycle which provides the supermarket with medium cooling and freezing temperatures. The proposed solution configuration was examined and evaluated in terms of energy performance by calculating the electricity saving per year of operation. This concept has been studied in detail as one of the most commonly used solar-driven absorption refrigeration technologies, but to the authors’ knowledge not in combination with a CO2 double-stage cooling topology [18,20,21]. The current theoretical study and its findings can be used in the actual employment of the proposed power reduction concept in new or existing supermarket refrigeration plants.
This study examines a theoretical supermarket transcritical CO2 refrigeration system with a cooling capacity of 80 kWR for the medium and 20 kWR for the low-temperature circuits, situated in the region of Athens, Greece. Figure 1 shows a simplified flowchart of the described configuration.

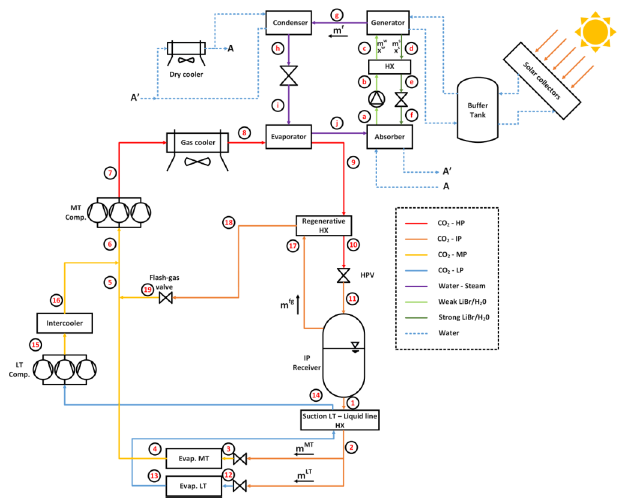
Figure 1 Flowchart showing the proposed refrigeration configuration.
The examined configuration includes a conventional double-stage CO2 refrigeration cycle (booster), in a form most commonly applied in actual commercial applications. This topology has four distinct operating pressure levels: low (LP), medium (MP), intermediate (IP) and high operation pressure (HP). The liquid receiver at IP (35 bar) stores CO2, which is then separated by gravity into saturated liquid and vapor phases. The liquid refrigerant from the bottom of the tank is driven to the display cabinets and cold-room at medium and low pressure, by medium-temperature (MT) and low-temperature (LT) evaporators. MP (27 bar) corresponds to evaporation temperature tevap MT= −10 °C, while LP (14 bar) refers to tevap LT= −30 °C. Refrigerant returned from LT evaporators is superheated by the main liquid line inside an intermediate heat-exchanger in order to remove any remaining liquid droplets at the compressors’ inlet. LT compressors deliver CO2 from the LP to the MP side, where excess heat produced is transferred to ambient using the intercooler heat exchanger. The CO2 vapor part on the top side of the liquid receiver tank, called “flash-gas”, is driven through the flash-gas valve to the MT compressors via suction, where it is mixed with the CO2 returning from MT evaporators and the LT compressor discharges respectively. MT compressors compress the total refrigerant flow to the high-pressure side. When the described topology is operated under subcritical conditions, the air-cooled gas cooler/heat exchanger on the HP side works as a condenser, which fully condenses refrigerant vapor to saturated liquid. However, during transcritical operation, the gas cooler can only cool refrigerant vapor down to 2–3°K over ambient temperature, because operation above the critical point liquid phase does not exist. CO2 exiting the gas cooler is slightly cooled inside the regenerative heat exchanger and then driven back to the liquid receiver, after being expanded inside the high-pressure valve (HPV). The so-called HPV regulates the pressure to the required set value according to the temperature at the gas cooler exit (tGC out).
The concept proposed regarding the reduction of power consumption in the described CO2 topology, lies in the integration of one solar-powered absorption chiller (ACH), which sub-cools CO2 on the HP side so as to increase the volumetric refrigeration capacity and the corresponding performance rate of the booster cycle. The absorption chiller works with a LiBr-H2O pair and includes a generator heat-exchanger, which absorbs heat from the hot water produced in the solar collectors, the evaporator heat-exchanger where the sub-cooling of the CO2 in the main cycle takes place, and the condenser and absorber heat-exchangers, which are both connected with a dry-cooler module to release excess heat to the ambient area. The ACH evaporator works at an evaporation temperature of tevap ach = 5 °C, a value that is inside the range of 5–15 °C usually used in absorption chiller arrangements [22]. The minimum temperature of the sub-cooled CO2 is selected to be 5°K higher than the ACH evaporation temperature, meaning that the corresponding temperature in this study is t9 min = 10 °C.
As mentioned above, the heat required to support the operation of the absorption chiller is produced in evacuated-tube solar collectors, installed either on the rooftop or in the surrounding area of the supermarket. The total required collector area was calculated so as to enable CO2 sub-cooling in the main cycle down to the minimum temperature of 10 °C during all the months of the year. The latter results in a total collector area of 115 m2, which corresponds to 50 collectors of 2.3 m2 each. The hot water produced is stored in a buffer tank, from which circulation pumps feed it to the ACH generator heat-exchanger. Additionally, the corresponding cooling capacity needed to support the aforementioned conditions leads to the selection of a nominal capacity of 60 kWR for the absorption chiller module.
Figure 2 illustrates the pressure-enthalpy graph of the CO2 cycle with and without solar-absorption chiller, for subcritical and transcritical operation.
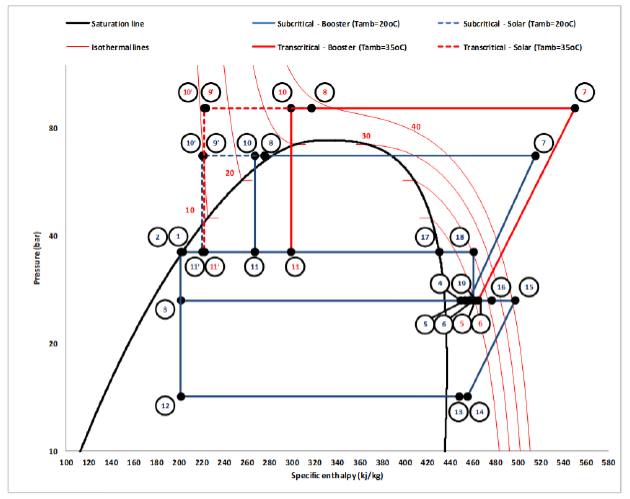
Figure 2 Log(p)-h graph of the examined CO2 cooling cycle.
The energy simulation of the proposed configuration employed the thermodynamic equations described in this section.
The refrigeration loads (Qevap) of the MT and LT evaporators were calculated using the following equations:
The isentropic efficiencies (ηis) of the MT and LT compressors were calculated according to the compressor pressure ratio from Dorin [23]:
Enthalpy values at the compressors outlets can be written as below:
Compressors power consumption (Wcomp) is given in the following equations, where mechanical efficiency, ηm=95%.
The fan power consumption (Wfans) on the devices rejecting heat in ambient air, corresponds to 3% of the rejected heat to ambient, which is a typical value for air-cooled devices [24]:
When different flows are mixed at mixing points or in devices, energy balance equations can be written as follows:
Liquid receiver:
Regenerative HX:
MT suction line:
Subcooling HX:
where Qsc is the rejected heat from the CO2 principal cycle to the absorption chiller sub-cycle.
Enthalpy values at the inlet and outlet of the expansion valves are equal, since throttling processes are considered to be ideal:
Heat exchange effectiveness (ηeff) is assumed to be 70%, and for the intermediate heat-exchangers can be written as below:
CO2 booster system coefficient of performance (COPbooster) is calculated as:
Energy balance equations are employed in all devices:
Evaporator:
Generator:
Condenser:
Absorber:
Intermediate heat-exchanger (IHX):
Solution heat-exchanger effectiveness is ηeff = 70%, which is given by the equation below:
Circulation pump power consumption is negligible:
Throttling processes are considered to have no heat losses to ambient, so:
Condenser and absorber temperature levels are the same:
Dry-cooler fan power consumption, (Wc,dry c), corresponds to 1.5% of the total rejected heat in the condenser and absorber [24]:
Total mass flow rate remains constant before and after the absorber:
The LiBr substance mass flow balance equation:
Absorption chiller coefficient of performance (COPach):
For the index evaluation of energy performance of the absorption chiller coupled with the CO2 booster configuration, the sum of all the distinct power consumptions of the CO2 booster and ACH arrangements (Wtotal) should be considered:
The energy efficiency evaluation of the examined configuration and its comparison to the standard system was performed by calculating the coefficient of performance (COP) using the equation below:
The climatic data used in this study corresponds to the real environmental data of the Athens region of Greece. The ambient temperature values used were taken from actual experimental measurements from the authors’ former study (19). The mean hourly ambient temperature fluctuation of each month is depicted in Figure 3.
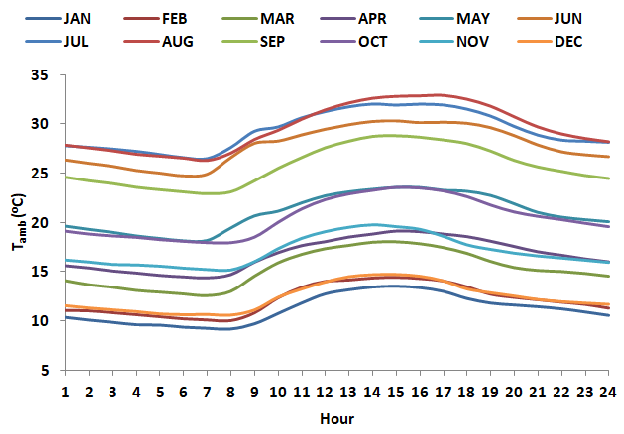
Figure 3 Average daily distribution of ambient temperature for every month of the year [19].
Refrigeration loads are dependent on the ambient temperature, thus Qevap MT and Qevap LT can be estimated using the following equation [25]:
where mfMT and mfLT are the minimum load factors, corresponding to 0.66 and 0.80 for medium and low temperature circuits respectively. Refrigeration loads for ambient temperatures below 5 °C are equal to the corresponding mf multiplied by installed capacities. For ambient temperatures >30 °C, refrigeration loads were considered equal to the installed capacity values.
Calculation of the average solar radiation on the inclined collector surface is calculated as below [26]:
The inclination angle of the collectors was selected to be at β=23ο, while the remaining parameters of equation (39) were calculated using Technical Chamber of Greece guidelines for the region of Athens, Greece [25]. The calculated average daily fluctuation in incident solar radiation onto the inclined surface of the collectors for every month of the year is shown in Figure 4.
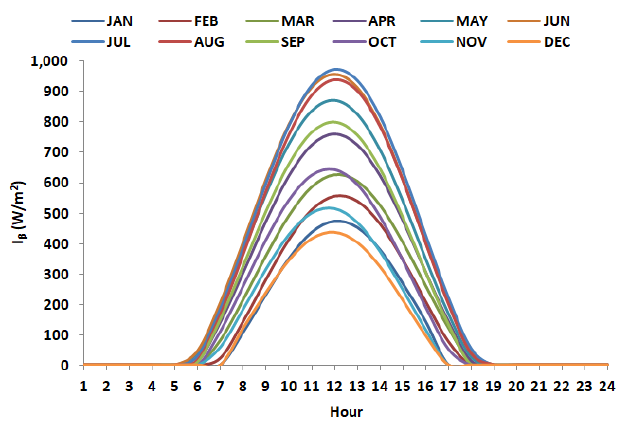
Figure 4 Average daily distribution of incident solar radiation for every month of the year.
The simulation of the described configuration and the implementation of the energy efficiency analysis were performed using the thermodynamic equations previously presented. The thermodynamic equations of the system were solved through optimization procedure developed using MATLAB, in which the CoolProp library has been integrated to calculate the required thermodynamic properties of the working fluids. An optimization procedure was used to reach the maximum value of the system’s COP, so as to find the optimal energy efficiency operation point for each running case. The optimization parameter is the HP value of the CO2 booster system during transcritical operation. A higher HP corresponds to a higher pressure ratio in the MT compressors, resulting in greater power consumption. During transcritical operation, the temperature at the gas cooler exit is only related to ambient temperature, so the higher the HP, the lower the flash-gas amount at IP, resulting in higher volumetric refrigeration capacity. As a result, for each transcritical CO2 topology, there is one corresponding optimal HP value in the gas cooler temperature working range [27]. In this study HP ranged from 74 to 120 bar for the optimization procedure.
The thermal efficiency of solar evacuated tube collectors (ETCs) can be estimated as follows [28]:
where the temperature values at inlet and outlet of collectors are Tcol in = 80 °C and Tcol out = 95 °C respectively [14].
The solar heat is stored in the buffer tank and is available to be charged into the ACH generator, according to the equation below:
The ACH generator working temperature (Tg) is considered to be 20°K below the collectors’ outlet water temperature (Tcol out) [14]. However, for every operation point, Tg should also be higher than the weak solution temperature at the HP level (Τg,min), and lower than the crystallization temperature of the working pair (Τg,max) [29]. The latter temperature values are calculated as:
The main simulation parameters are given in Table 1, while the most important assumptions made in the current analysis are presented below:
The simulation is performed under steady-state conditions.
There are no energy losses in expansion devices, meaning that enthalpy values are constant.
There is negligible SH increment due to external sources on MT and LT suction lines.
CO2 and ACH condensers work with zero SC.
Condensing temperature is equal for CO2 and ACH subsystems.
There are negligible pressure losses in all devices and tubes.
There are no heat transfer losses between the different devices/components and their surroundings.
Table 1 Main simulation parameters in the current study.

In Figure 5, a flow chart of the developed simulation model is presented. The sequence of performed calculations is shown, as well as a description of the optimization procedure.
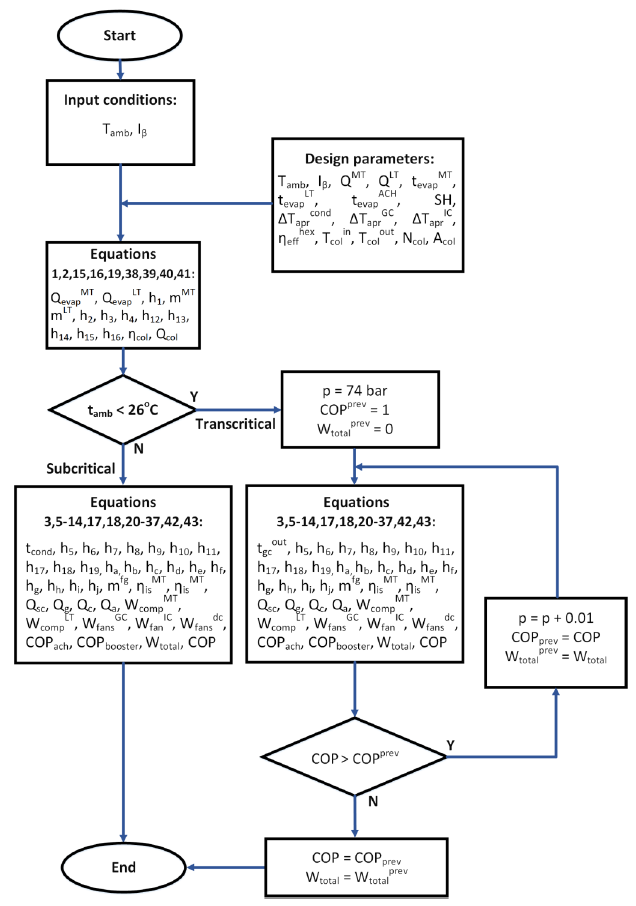
Figure 5 Flow chart of the simulation model.
The accuracy of the developed simulation model was validated using simulation results from the literature derived from similar theoretical approaches, because, to the best of our knowledge, there are no experimental data available for the topology specifically described here. A similar CO2 booster refrigeration system integrated with a solar absorption module was analyzed in the selected reference [4], but their system did not include the internal heat-exchangers utilized in our system topology, which increase system efficiency. In addition, the reference study incorporated a parallel (auxiliary) compressor concept, which was omitted from the current study, because it is not often used in the commercial CO2 refrigeration systems installed in Greece. The simulation process in the reference study was made by employing the environmental data from five typical, representative cities in China, while rest parameters of the developed simulation model are presented in the respective reference. The ambient temperature in the reference study ranged from 18.21 to 32.88 °C. The latter temperature covers the operation of the CO2 cycle in both subcritical and transcritical modes, enabling confirmation of the respective simulation results. The solar radiation ranging from 218.34 to 533.77 W/m2 may not correspond to the high solar radiation values occurring during summer in Greece, but it is acceptable for validation purposes. The reason for this is that higher solar radiation values do not introduce any modification to the system operation function, as they only increase the degree of sub-cooling in the CO2 cycle and the respective efficiency figures. Table 2 presents the COP calculations of the current study’s simulation model and the respective deviation values for the same climatic data. The validation results show very good agreement with the reference data, since the average absolute deviation of COP was 1.96%.
Table 2 Simulation model validation utilizing data from reference [14].
Having validated the simulation model of the double-stage CO2 cycle coupled with the solar absorption chiller, the next step of this study was to perform a parametric analysis of the examined topology in correlation with ambient temperature. At ambient temperatures ranging from 1 to 40 °C, the COP of the total arrangement was calculated for the cases of low (450 W/m2) and high solar radiation (800 W/m2). The results are presented in Table 3 and they are also depicted in Figure 6, where they are compared with the respective COP values of a conventional CO2 booster system. According to the results of the described parametric analysis, for low solar radiation the maximum increment of the COP was 26.44%, namely from 2.11 to 2.67 for Tamb = 24 °C, while for high solar radiation, the maximum increment corresponded to 47.34%, from 1.51 to 2.23 for Tamb = 33 °C.
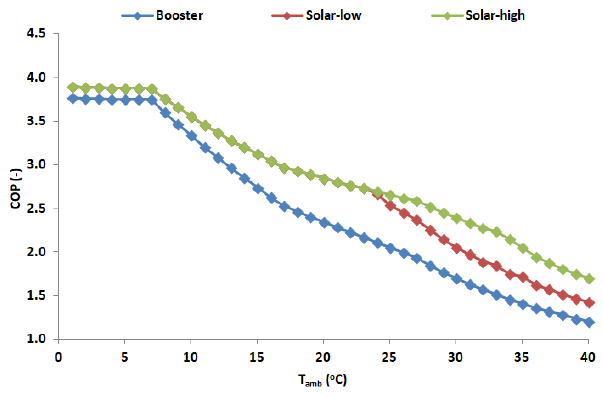
Figure 6 COP distribution of the examined topology at different ambient temperatures.
In Figure 7, the mean daily COP fluctuation is illustrated for three representative months of the year (January, April, and July). The results are compared with those from the conventional system, using the climatic data of the region of the examined supermarket for the respective months. As shown in the diagram, for each of the three months, there was a COP enhancement during the sunshine hours of the day. For the remaining hours of the day, the energy performance was equal since solar energy was unavailable. Additionally, during the summer period when temperatures were higher, the energy performance of the system was lower in comparison to the winter period. Lastly, the improvement of COP was higher during the summer period, since the solar radiation was greater.
Table 3 COP parametric analysis results for the examined topology.

Figure 7 Average daily COP distribution of the proposed system for three typical months.
The evaluation of system energy performance for the entire year is enabled by calculating the average value of the COP for every month of the year. The latter is illustrated in Figure 8 in comparison with the corresponding COP values for the conventional system. The lower energy efficiency rates during the summer period are once again shown in this graph, and as discussed, they mainly occur at the higher temperature levels which lead to transcritical operation.
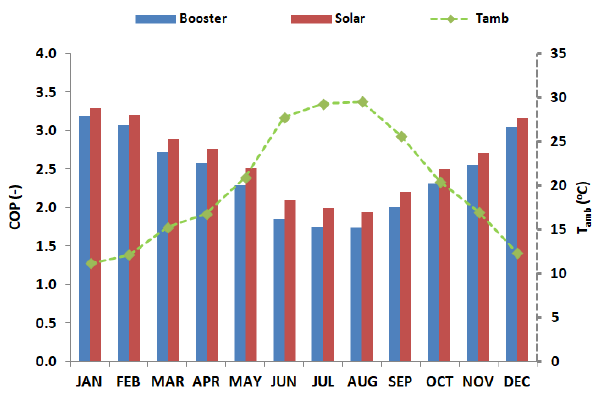
Figure 8 Average monthly COP of the proposed system and annual distribution of ambient temperature.
Figure 9 depicts the amount of thermal energy (Eth sc) required monthly for sub-cooling the proposed configuration, which corresponds to the produced cooling result in the evaporator of the absorption chiller. In the same graph, the required monthly absorbed thermal energy in the generator of the absorption chiller (Eth g) is also presented. The latter is compared with the solar thermal energy actually produced monthly in the collectors (Eth col), which is available for exploitation. The results show that ACH generator does not absorb the entire amount of solar heat available. More precisely, only the amount of heat needed to produce the required SC of CO2 in the ACH evaporator is fed to the generator. Summer months and especially August have the highest exploitation rate, where the area with pink color in the graph corresponds to the amount of monthly thermal energy which remains unexploited.

Figure 9 Annual distribution of monthly thermal energy absorbed in the ACH.
The last step of the current analysis is the calculation of the annual electricity consumption of the proposed configuration and its comparison to that used by the conventional CO2 booster system. The results given in Figure 10 confirm that the proposed energy-saving process gives better energy performance, with an 8.93% lower annual power consumption in comparison to the conventional system, corresponding to 30.19 MWh/year lower energy consumption. The greatest energy savings of 11.44% was achieved in July which is the month with the highest solar radiation.
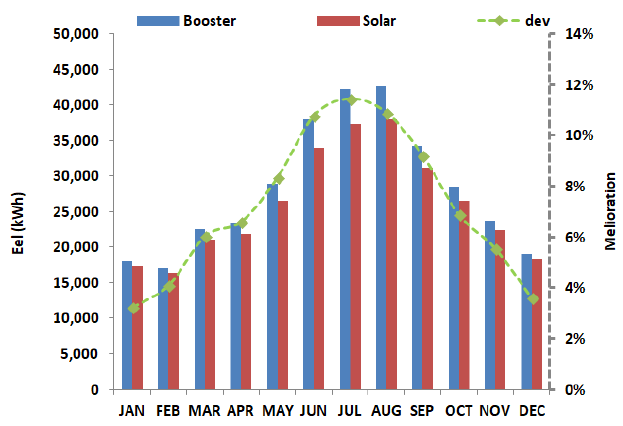
Figure 10 Monthly electricity consumption of the studied system for the year.
In this study, we investigated the integration of a solar-driven absorption chiller into a double-stage CO2 refrigeration system. The solar absorption chiller sub-cools the CO2 in the conventional double-stage cycle. The performance evaluation of the proposed concept reflects the energy efficiency analysis of the described coupled topology as a whole. The most important findings and conclusions derived from this approach are summarized below:
The proposed topology is more efficient than the corresponding conventional system. Using real climatic data of the region of the examined supermarket, an annual energy saving of 8.93% can be achieved, corresponding to 30.19 MWh/year.
Parametric analysis of the configuration performance resulted in maximum COP enhancement of 47.35%.
Higher energy saving figures were achieved during the summer months, when the ambient temperature and the solar radiation were highest. Also, the exploitation of solar heat produced is also higher during the summer period.
The proposed process is a very promising energy saving solution for CO2 refrigeration systems in southern European countries like Greece, since it enables performance enhancement by exploiting solar energy, which has extremely high potential in the Mediterranean region. The only drawback of the described configuration is linked to the high investment cost of sorption technology. Currently, investment capital is not sufficient for commercial maturation of such a project.
A parametric analysis of collector area plus the dynamic simulation of the impact of the hot-water storage tank in the described system on its operation and energy efficiency would make an interesting future study.
The unexploited amount of solar heat produced by the absorption chiller could be further examined as a way to cover other energy needs of a supermarket building like sanitary water production, or possibly to be stored using phase-change materials (PCM) to feed the absorption generator during the hours of negligible solar radiation.
Not applicable.
This research was not funded.
The authors have declared that no competing interests exist.
Evangelos Syngounas: Conceptualization, Methodology, Software, Data Curation, Writing - Original Draft, Visualization
Dimitrios Tsimpoukis: Conceptualization, Methodology, Software, Data Curation, Writing - Review & Editing
Maria K. Koukou: Methodology, Writing - Review & Editing, Visualization, Supervision
Michail Gr. Vrachopoulos: Conceptualization, Writing - Review & Editing, Supervision.
| 1. | Tassou SA, Ge Y, Hadawey A, Marriott D. Energy consumption and conservation in food retailing. Appl Therm Eng. 2011;31(2–3):147-56. [Google Scholar] [CrossRef] |
| 2. | European Commission. Regulation (EU) No 517/2014 of the European Parliament and of the Council of 16th April 2014 on fluorinated greenhouse gases and repealing Regulation (EC) No 842/2006 [Internet]. Official Journal of the European Union; 2014 [cited 18/09/2021]. Available from: http://eur-lex.europa.eu/eli/reg/2014/517/oj. |
| 3. | Lorentzen G. Revival of carbon dioxide as a refrigerant. Int J Refrig. 1994;66(721):9-14. [Google Scholar] [CrossRef] |
| 4. | Ge YT, Tassou SA. Thermodynamic analysis of transcritical CO2 booster refrigeration systems in supermarket. Energy Convers Manag. 2011;52:1868-1875. [Google Scholar] [CrossRef] |
| 5. | Gullo P, Elmegaard B, Cortella G. Advanced exergy analysis of a R744 booster refrigeration system with parallel compression. Energy. 2016;107:562-71. [Google Scholar] [CrossRef] |
| 6. | Syngounas E, Tsimpoukis D, Mitsopoulos G, Girotto S, Anagnostatos S. Comparative Analysis and Evaluation of a CO2 Transcritical Refrigeration System Before and After Optimization Configurations. 18th European Conference—The Latest Technology in Refrigeration and Air Conditioning; 6-7 June 2019; Politecnico of Milan.. p.6-7. |
| 7. | Tsimpoukis D, Syngounas E, Bellos E, Koukou M, Tzivanidis C, Anagnostatos S. Investigation of energy and financial performance of a novel CO2 supercritical solar-biomass trigeneration system for operation in the climate of Athens. Energy Convers Manag. 2021;245:114583. [Google Scholar] [CrossRef] |
| 8. | Gullo P, Hafner A, Banasiak K, Minetto S, Kriezi EE. Multi-ejector concept: A comprehensive review on its latest technological developments. Energies. 2019;12(3). [Google Scholar] [CrossRef] |
| 9. | Gullo P, Cortella G, Minetto S, Polzot A. Overfed Evaporators and Parallel Compression in Commercial R744 Booster Refrigeration Systems—An Assessment of Energy Benefits. 12th IIR Gustav Lorentzen Natural Working Fluids Conference; 21–24 August 2016; Edinburgh, UK.. |
| 10. | Girotto S, Minetto S, Neksa P. Commercial refrigeration system using CO2 as the refrigerant. Int J Refrig. 2004;27(7 SPEC. ISS.):717-723. [Google Scholar] [CrossRef] |
| 11. | Purohit N, Sharma V, Fricke B, Kumar D. Parametric analysis and optimization of CO2 trans-critical cycle for chiller application in a warm climate. Appl Therm Eng. 2019;150(August 2018):706-719. [Google Scholar] [CrossRef] |
| 12. | Mitsopoulos G, Syngounas E, Tsimpoukis D, Bellos E, Tzivanidis C, Anagnostatos S. Annual performance of a supermarket refrigeration system using different configurations with CO2 refrigerant. Energy Convers Manag X. 2019;1(January):100006. [Google Scholar] [CrossRef] |
| 13. | Liu Y, Sun Y, Tang D. Analysis of a CO2 transcritical refrigeration cycle with a vortex tube expansion. Sustainability. 2019;11(7):2021. [Google Scholar] [CrossRef] |
| 14. | Sun Z, Wang C, Liang Y, Sun H, Liu S, Dai B. Theoretical study on a novel CO2 Two-stage compression refrigeration system with parallel compression and solar absorption partial cascade refrigeration system. Energy Convers Manag. 2020;204(August):112278. [Google Scholar] [CrossRef] |
| 15. | Song M, Wang L, Yuan J, Wang Z, Li X, Liang K. Proposal and parametric study of solar absorption/dual compression hybrid refrigeration system for temperature and humidity independent control application. Energy Convers Manag. 2020;220(April):113107. [Google Scholar] [CrossRef] |
| 16. | Avezova NR, Kasimov FS, Niyazov SK. Experimental investigation of thermal performance and heat efficiency of solar absorption capacious water heating collectors manufactured using local materials. Appl Sol Energy. 2010;46(4):263-265. [Google Scholar] [CrossRef] |
| 17. | Masheiti SA, Agnew B, Talbi M, Atan R, Walker S. Environmental and thermal benefits of linking Brayton, absorption chiller, and organic Rankine cycles with low-enthalpy geothermal source at an arid-zone area of Libya. Proc Inst Mech Eng Part A J Power Energy. 2012;226(4):545-555. [Google Scholar] [CrossRef] |
| 18. | Bellos E, Tzivanidis C, Torosian K. Energetic, exergetic and financial evaluation of a solar driven trigeneration system. Therm Sci Eng Prog. 2018;7:99-106. [Google Scholar] [CrossRef] |
| 19. | Tsimpoukis D, Syngounas E, Petsanas D, Mitsopoulos G, Anagnostatos S, Bellos E. Energy and environmental investigation of R744 all-in-one configurations for refrigeration and heating / air conditioning needs of a supermarket. J Clean Prod. 2021;279:123234. [Google Scholar] [CrossRef] |
| 20. | Mohammadi K, McGowan JG. A thermo-economic analysis of a combined cooling system for air conditioning and low to medium temperature refrigeration. J Clean Prod. 2019;206:580-97. [Google Scholar] [CrossRef] |
| 21. | Kalair AR. Review of carbon dioxide (CO2) based heating and cooling technologies: Past , present , and future outlook. Int J Energy Res. 2019;1-56. [Google Scholar] |
| 22. | Llopis R, Cabello R, Sánchez D, Torrella E. Energy improvements of CO2 transcritical refrigeration cycles using dedicated mechanical subcooling. Int J Refrig. 2015;55:129-141. [Google Scholar] [CrossRef] |
| 23. | Dorin. Dorin software. 2019 [cited 11/10/2020]. Available from: http://www.dorin.com/en/Software. |
| 24. | Karampour M, Sawalha S. State-of-the-art integrated CO2 refrigeration system for supermarkets: A comparative analysis. Int J Refrig. 2018;86:239-257. [Google Scholar] [CrossRef] |
| 25. | Zhang M. Energy analysis of various supermarket refrigeration systems. International Refrigeration and Air Conditioning Conference Paper 856 [Internet]; 2006 [cited 15/10/2020]. Available from: http://docs.lib.purdue.edu/iracc/856. |
| 26. | T.O.T.E.E. 20701-3/2010 Climate data of Greek Cities, Technical Directive by the Technical Chamber of Greece [Internet]. 2010 [cited 05/10/2020]. Available from: http://www.helapco.gr/ims/file/installers/totee-klimatika.pdf. |
| 27. | Gullo P, Elmegaard B, Cortella G. Energy and environmental performance assessment of R744 booster supermarket refrigeration systems operating in warm climates. Int J Refrig. 2016;64:61-79. [Google Scholar] [CrossRef] |
| 28. | Kalogirou S. The potential of solar industrial process heat applications. Appl Energy. 2003;76(4):337-361. [Google Scholar] |
| 29. | Bellos E, Tzivanidis C. Enhancing the performance of a CO2 refrigeration system with the use of an absorption chiller. Int J Refrig. 2019;108:37-52. [Google Scholar] [CrossRef] |

![]()
Copyright © 2026 Pivot Science Publications Corp. - unless otherwise stated | Terms and Conditions | Privacy Policy


