Green Energy and Sustainability ISSN 2771-1641
Green Energy and Sustainability 2022;2(1):0002 | https://doi.org/10.47248/ges2202010002
Original Research Open Access
From the Building to the Building Stock: Investigation of the Transformations of the Building Stock of the City of Athens for its Conversion into a Carbon Neutral City
Eleftheria Alexandri
†


Correspondence: Eleftheria Alexandri
Academic Editor(s): Thomas Kotsopoulos, Georgios Martinopoulos, Giorgos Panaras
Received: Sep 30, 2021 | Accepted: Nov 3, 2021 | Published: Jan 20, 2022
This article belongs to the Special Issue Selected Papers from the 12th National Conference of IHT
© 2022 by the author(s). This is an Open Access article distributed under the terms of the Creative Commons License Attribution 4.0 International (CC BY 4.0), which permits unrestricted use, distribution, and reproduction in any medium or format, provided the original work is correctly credited.
Cite this article: Alexandri E. From the Building to the Building Stock: Investigation of the Transformations of the Building Stock of the City of Athens for its Conversion into a Carbon Neutral City. Green Energy Sustain 2022; 2(1):0002. https://doi.org/10.47248/ges2202010002
Background: This paper examines the hierarchy of technologies for a sustainable mitigation of greenhouse gas emissions from the building sector in the City of Athens. The greenhouse gas inventory of the building stock of the city and its energy consumption is investigated, pinpointing to effective energy saving scenarios, in which available in the market technologies are examined for their efficiency, cost-effectiveness and sustainability.
Methods: Criteria for selecting these technologies have derived from the United Nations Sustainable Development Goals. By using the Multi Attribute Utility Theory, these technologies are prioritised, taking into account the reduction of greenhouse gas emissions, energy savings, the payback period of the embodied energy of the technologies used for the energy upgrade of buildings, their impact on the heat island effect, the initial cost of the investment and its payback period. Through the dynamic hypothesis on greenhouse gas emissions from electricity generation, cost-benefit analysis highlights the actions that can significantly reduce greenhouse gas emissions with existing low-cost technologies, so that they are easily multipliable and practically applicable on the city’s building stock.
Results: A feasible timetable for the measures for the energy upgrade of the building stock of the city of Athens, so that actions that offer considerable greenhouse gas emissions reductions at low costs are applied first, with short payback period and small initial investment. Actions focusing on HVAC systems have been found to meet these conditions.
Conclusions: This research pinpoints to primary directions for financing strategies that can lead to the energy upgrade of the building stock, in order to meet the target for carbon neutrality of the city by 2050.
Keywordszero energy building, embodied energy, carbon neutral city, sustainable development goals, multi-criteria analysis, Multi Attribute Utility Theory
It is anticipated that by 2050, 68% of the world population will be living in urban areas [1]. It is also expected that climate change will cause approximately 250,000 additional annual deaths from 2030 to 2050 [2]. In addition, the impacts of climate change experienced within the next decades are expected to be more severe for urban than rural populations [3]. Cities have a large share in this; they account for approximately 78% of the world’s energy consumption and are responsible for 60% of the total greenhouse gas emissions, occupying less than 2% of the Earth’s surface [4].
There is growing awareness from several cities around the globe that sustainable management of city assets is the only option for their successful development and survival, which includes both adaptation and mitigation of climate change [5]. Cities that have ratified Paris Agreement have committed to keep global average temperature rise below 1.5 °C [6]. With the IPCC Special Report on Climate Change and Land [7], it is underlined that in order to achieve this goal, net zero greenhouse gas emissions should be achieved by 2048 (50% probability), this probability being improved by 2/3rds, if GHG emissions fall up to 70% by 2030 (compared to 2017 levels). For cities to accomplish this systemic and rapid change specified by Paris Agreement, it is crucial that they are transformed into carbon neutral ones by 2050 [8], with the advocation that local actions can have an immediate impact on the environment. This ambitious goal must be supported by efficient actions, prioritized in an effective way, in order to achieve cities’ independence from carbon economy within the next 30 years.
The City of Athens, participating in this call, has managed to lower its greenhouse gas emissions by 14% within the last 6 years. These efforts to mitigate greenhouse gas emissions and to adapt to climate change, have placed Athens in the “A-list” of cities of the CDP net for four consecutive years [9]. In order to achieve the ambitious goal of carbon neutrality by 2050 and steep decline of GHG emissions by 2030, the city has to act fast and efficiently in all sectors that are responsible for GHG emissions within the city; stationary energy consumption, transport, waste generation and industrial uses. Especially for buildings, which account for 57% of the city’s total greenhouse gas emissions (see paragraph 3.1), energy saving measures must enter the agenda in a cost–(carbon) effective way. Yet these solutions should ensure the sustainable development of the city.
The aim of this paper is to examine whether and how sustainable carbon neutrality can be achieved through the building sector in the city of Athens up to 2050, with the already available in the market technologies.
The city of Athens is located at 38° latitude and 24° longitude, with an altitude of approximately 130m above sea level, in the centre of Metropolitan Athens, occupying 39 km2. The climate of Athens is characterised as subtropical, Mediterranean, with prolonged hot, dry summers and mild winters, with moderate rainfall [10]. The average annual temperature is 17.7 °C, based on the meteorological station of Thissio (Figure 1) [11]. The heat island effect is intense in Athens and neighbouring municipalities, while in coastal areas temperatures tend to be milder in summer [12]. Average annual temperature in Athens has been increasing since the 1970s: from 1970 to 2011 it has already risen by 1.3 °C [11], while it is expected to rise by 0.14 °C per decade from now onwards [13]. However, the upward trend is more pronounced during summer period: average maximum temperature has increased by 3.2 °C (1976–2008) and average minimum (night) temperature by 3.3 °C (1984–2008) [10], while it is expected to rise from 1.4 °C to 2.0 °C up to 2050 [13]. Heat waves follow an increasing tendency both in frequency and duration [10], with a trend of intensification by 3–5 days [14]. This will result in up to 15 additional days a year with maximum temperatures above 35 °C and up to 30 additional days with night-time temperatures above 20 °C [13]. An increase in the maximum daily summer temperature of 1 °C is estimated to lead to 432 additional deaths per year by 2030 [10].
These particularly intense climatic changes in Athens are the result of the combination of various factors, mainly anthropogenic, related to intensifying urbanisation, the destruction of suburban green by forest fires, as well as global anthropogenic and natural causes of climate change [3]. Urbanisation has played a preliminary role in the intensity of the heat island effect in Athens. Earlier measurements (e.g., [15]) had shown high heat island effect intensity of the magnitude of 8 °C. More recent research, based on both air temperature measurements and satellite surface temperature observations, shows a lower heat island intensity (of the magnitude of 4 °C), which is stronger at night, due to the large heat capacity of structural materials within the city, both at street and at building level [16]. In contrast, many areas of the Municipality of Athens are cooler during the day, compared to neighbouring municipalities [12,16]. From this observation it is deduced that apart from the albedo of urban materials, special care should also be given on the specific heat of structural materials that are exposed to the city’s surface, including both buildings and public spaces. Thus, the external thermal insulation of both the building stock and new buildings can effectively help not only to reduce the energy consumption of a building, but also to reduce the heat capacity of the built environment and the nocturnal intensity of the heat island effect; consequently lower raised nocturnal urban temperatures and hence increase the effectiveness of night cooling of buildings; this can lead to the further reduction of the cooling load and, simultaneously, the improvement of thermal comfort in urban spaces.

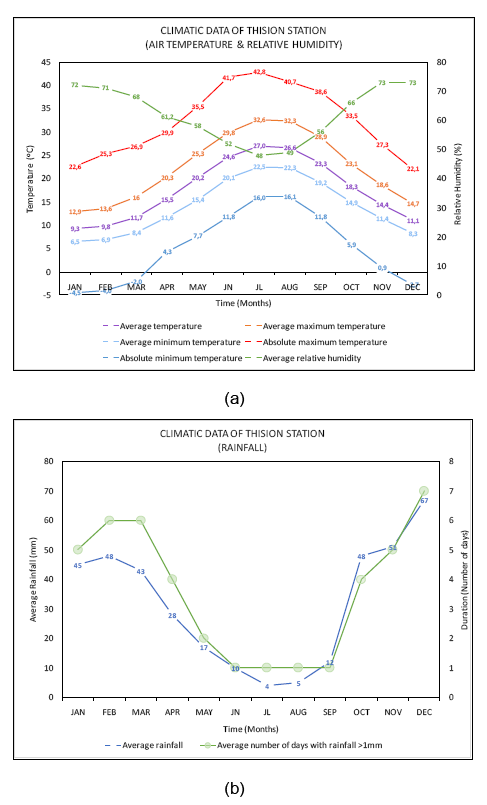
Figure 1 (a) Average monthly, average maximum, absolute maximum, average minimum and absolute minimum temperature and average monthly relative humidity and (b) average monthly rainfall and average number of days with rainfall larger than 1 mm in Athens (source of data: [11]).
According to the latest census [17], 75% of the building stock of the city is built before the Regulation of the Thermal Insulation of Buildings [18], not having any kind of thermal protection (Figure 2a), apart from a few exceptions, where partial or holistic energy upgrade has taken place. Residencies constitute 78.8% of the building stock (Figure 2b).
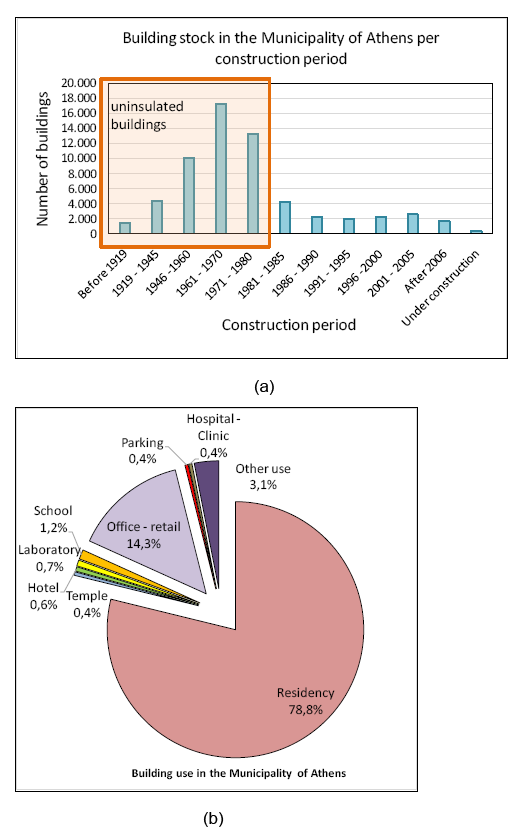
Figure 2 Athenian building stock (a) per construction period and (b) per use (source of data: [17]).
The majority of them (60%) are apartment buildings (above 3 floors) [17]. The income decrease, due to the austerity that the country is facing, in relation to the relatively large thermal needs to achieve the feeling of thermal comfort in the uninsulated Greek homes, leads to energy poverty. Typically, 35.6% of Greek households could not pay their energy bills on time in 2018; Greek households have ranked first in Europe in terms of this incapacity [19]. It is estimated that 26% of Athenian homes face energy poverty [20]. From these two observations it can be presumed that if energy poverty continues to be addressed only in economic terms (e.g., subsidies) and not in technological terms (e.g., funding the energy upgrade of residencies, especially in households affected by energy poverty), it is estimated that greenhouse gas emissions from the city building stock will increase when the economic conditions of the country improve. Therefore, in order to reduce greenhouse gas emissions in the City of Athens, while improving living standards and tackling poverty, energy saving projects should target for large greenhouse gas emissions in the residential sector and, generally, in the building sector. Targeted funding actions should result in significant decrease and even zero greenhouse gas emissions, at relatively low cost, so that they can be easily multiplied, which is what this article examines.
To be able to project to the future, present and past (in the form of “trends”) GHG emissions should be examined. The City of Athens, after signing the Compact of Mayors [21], monitors its greenhouse gas emissions, according to the GPC i [22] and to IPCC [3], continuously, from 2014 onwards. The inventory takes place annually and estimates greenhouse gas emissions two years ago.
The City of Athens reports its GHG emissions from stationary sources, transport, waste, industrial processes and product use (IPPU) and agriculture, forestry and other land use (AFOLU) on the platform CDP, where the quality of data is validated by various organisations [23]. This article focuses on stationary GHG emissions, which concern energy consumption from the stationary sector, where buildings are included [22].
Regarding the inventory of stationary energy consumption, the sources and assumptions are summarised in Table 1. When available, energy consumption derives directly from the providers; this stands true for all electricity consumption within the city. Stationary electricity consumption is divided among the different types of buildings (residencies and tertiary sector), street lighting, construction activities, industrial or gardening activities by the provider of electricity itself. The same applies to natural gas consumption, which also derives directly from the provider of natural gas, for residencies, tertiary sector buildings as well as industrial activities. Other fossil fuel consumption for industrial consumption derives from the data of the Ministry of Environment, Energy and Climate Change.
Table 1 Source of data/assumptions for stationary activities in the City of Athens inventory and data quality assessment, according to [22] and [24].

All this data is input in the software CIRIS v.2.4 [25] iii , along with the emission factors for each type of fuel/energy source. These emission factors derive from the National Inventory Report [26] on an annual basis, regarding both fossil fuels and electricity. The results from this monitoring and the role of buildings in the overall energy consumption of the city are discussed in paragraph 3.1. Data from this inventory are used as guidance for necessary plans on energy saving actions in the building sector.
Fossil fuels emission factors remain relatively constant, while electricity emissions factor varies, according to the annual energy mix for electricity production. So as to project the change of greenhouse gas emissions from electricity generation within the next years, in which this article focuses, a linear decreasing function has been considered, based on the existing time series as well as on the national targets for 2030 [27], as shown in Figure 3.
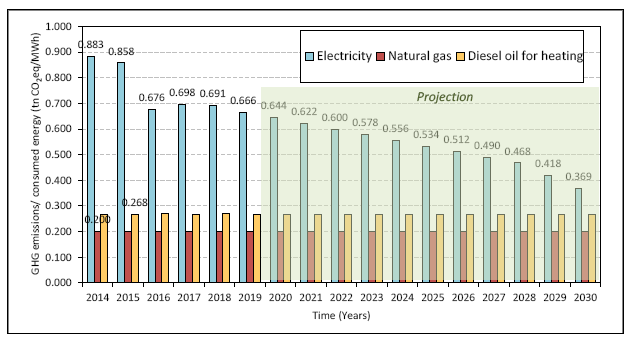
Figure 3 Greenhouse Emission factors for electricity, natural gas and diesel oil – time series for 2014–2019/projection for 2020–2030.
Nowadays there is a plethora of available in the market technologies for energy savings in buildings. The question that this research raises is which energy saving measures are the most adequate ones per case, so that these energy saving measures are sustainable, feasible and capable to reach the goal of carbon neutrality of Athenian buildings by 2050.
Up to date, energy savings in buildings have been assessed mostly with the criterion of optimising energy savings (e.g., [28–33]), not taking into consideration other social or economic criteria, which might be obstacles in the implementation of these energy saving techniques in practice. Although multicriteria analysis has been used mainly in large scale energy systems (e.g., [34–39]), there are a few studies that have used multicriteria analysis for the energy upgrade of buildings: Mokhara et al. [40] have used the Analytic Hierarchy Process to assess energy savings and RES applications in dwellings in Algeria; they assess their criteria in three pillars; technical and economical, in which the criteria of initial cost, lifetime and local market availability are assessed, environmental and ecological, in which GHG mitigation, thermal comfort and water use are put forward and social, in which public acceptance and job creation are examined as criteria. Alexandri and Androutsopoulos [41] have assigned the Multi Attribute Utility Theory to assess already established in the market technologies for the energy upgrade and the application of RES on buildings for detached dwellings in Greece with the criteria of energy savings and the change in the energy class of buildings as energy criteria, the reduction of carbon dioxide emissions as environmental criterion, the reduction of operational costs as social criterion and the investment cost and its payback period as the examined economic criteria. Arroyo et al. [42] have used the Choosing by Advantages method with 3 criteria: energy consumption, acoustic reverb and VOC emissions, in order to assess the design scenarios for a building. Avgelis and Papadopoulos [43] have used ELECTRE III, focusing on the performance of HVAC systems in an office building, assigning energy (annual energy consumption), environmental (greenhouse gas emissions), economic (net present value method) and user’s satisfaction (thermal comfort and indoor air quality) criteria. There has been no consistent methodology either for the multicriteria analysis method or for the criteria for assessing energy upgrade techniques.
With the intention of highlighting energy-saving measures that can reduce greenhouse gas emissions in a sustainable and cost-effective manner, a multi-criteria analysis is developed to prioritise energy-saving measures that are available in the market. The examined scenarios are ranked with the Multi Attribute Utility Theory, based on Alexandri [44]. A sensitivity analysis is made, regarding weighting factors (Table 2); they (i) are set equal for all examined criteria, (ii) have derived from a survey iv to the engineers engaged in the building sector in the Municipality of Athens (56% of which have responded), (iii) only the environmental criteria of Table 2 are taken into consideration, (iv) only the economic and social criteria of Table 2 are taken into consideration and finally, (v) the aim (the reduction of greenhouse gas emissions) and the main obstacle (the initial cost [45]) are only considered.
Criteria have been selected to represent the elementary United Nations Sustainable Development Goals (SDGs) [46], which relate to buildings and energy-saving actions. They are divided into environmental protection criteria and economic growth/social equity criteria, to describe the three pillars of sustainability [47]. The SDGs that are more relevant to the energy upgrade of buildings are considered to be the following:
For environmental protection:
SDG 11 – Sustainable Cities and Communities, as the examined buildings are within a city, their effect on the city’s well-being should also be examined.
SDG12 – Responsible consumption and production: the prudent consumption of energy, both at operational and at construction level, is one of the desired results in the energy upgrade of buildings
SDG13 – Climate action, which is the most crucial environmental protection goal that should be addressed in all climate action plans and strategies
For social equity and economic growth, the following SDGs are examined:
SDG 1 – No poverty: energy poverty is on the rise, at EU [48,49], national [50,51] and within the city level [20,52], as also mentioned in paragraph 1.2. Eliminating the building’s energy operational costs, decreases energy poverty, thus helping to relief poverty.
SDG 8 – Decent work and economic growth, which is an essential goal for any investment activity.
For each selected SDG, one or more criteria are assigned, while each criterion is expressed by a quantifiable indicator: the reduction of energy consumption in buildings is chosen to express the criterion “Responsible Consumption and Production” for SDG12 [53]. Two indicators are set for the criterion “Climate Action” (SDG13): the reduction of greenhouse gas emissions as well as the payback period of the embodied energy [54]. For SDG11 “Sustainable Cities and Communities”, the reduction of urban heat capacity is chosen, as a measure for reducing the nocturnal heat island effect (see paragraph 1.2).
For SDG1 “No poverty”, the reduction of operating costs is chosen, as a means of facing energy poverty through energy efficient buildings [55]. Finally, for SDG8 “Decent work and economic growth”, the initial cost of the technical project and its payback period are chosen as indicators [56].
The methodology for quantifying each indicator depends on the nature of the indicator and is shown in Table 2. The software TEE KENAK [57] is used for estimating energy consumption and thus energy savings for each scenario, its initial operational costs and its investment payback period. This software is chosen because it is the national software for the estimation of the energy performance of buildings [58]. It has been validated with the method BESTEST [57] and has been used in numerous research studies (e.g., [45,59–63]). More specifically, the cost of each energy upgrade action that is input in the software is estimated according to the Regulation on the Descriptive Works Invoices for Public Works Contracts [64] and from market research. Greenhouse gas emissions are estimated with the excel-based tool CIRIS v.2.4 [25], taking into consideration the official national emission factors [26] for each energy source for carbon dioxide (CO2), methane (CH4) and nitrogen dioxide (NO2), while future projections for electricity derive from [27], as discussed in paragraph 2.1. The emissions of these greenhouse gases are converted to carbon dioxide equivalent (CO2e) according to IPCC 5AR [65].
The embodied energy of the energy saving actions and its payback period are estimated according to existing embodied energy databases, such as [66–68] v , while the embodied energy of HVAC, LED and solar systems have derived from [69–71]. The payback period of the embodied energy of each scenario is estimated with the simple payback period, by dividing the energy savings of each scenario to its embodied energy [72].
Table 2 Selected criteria, respective indicators and methodology for the expression of Sustainable Development Goals for environmental protection economic growth and social equity.
According to the optical analysis of the Google EIE tool [73], buildings tend to occupy approximately 61% of the urban surface in Athens. Taking into consideration that 71% of the Athenian building stock is higher than two floors [17], it is obvious that building surfaces (both horizontal and vertical) play a more crucial role in the city’s overall thermal capacity than the superficial two-dimensional surfaces of open spaces. High thermal capacity plays a crucial role in the nocturnal heat island effect intensity [16,74,75], which can cause higher morbidity and mortality risks than daytime heat island intensity [76,77]. It is made obvious from this, that by enclosing building materials’ heat capacity within the building with external insulation, not only is it beneficial for lowering the cooling load of buildings [78], but also for lowering urban thermal capacity, thus nocturnal heat island intensity and its negative effects on human health. For this reason, external insulation is considered to have a positive effect on the reduction of nocturnal heat island intensity, the health of the inhabitants and generally to improve the sustainability of cities (SDG11). As the examination of specific urban geometries is beyond the scope of this article, the simplified approach of the existence/non-existence of external insulation in each scenario, as a means of reducing nocturnal heat island intensity, is translated as “1” and “0”, in the MAUT analysis.
For the examination of energy saving scenarios, two types of buildings have been selected; an apartment for the residential sector and an office for the tertiary sector, as typical typologies of these two uses. The characteristics of these two examined buildings are presented in paragraphs 2.2.1 and 2.2.2. As the view of a typical building affects the results regarding the energy consumption and the efficiency of the various energy saving techniques, it may differ for the whole building stock [79], but it is one of the most common methodologies in order to draw general conclusions for the development of a strategy for energy saving measures in the building sector [80] and their hierarchy.
As mentioned in paragraph 1.2, the typical residence in Athens is the apartment. In addition, the majority of residencies in the Prefecture of Attica, where Athens is geographically situated, cover an area of 60–79m2 [17]. For this reason, energy saving scenarios are considered for a 70m2 Athenian apartment (Figure 4). The apartment that has been chosen is considered a typical one, according to the taxonomy of Athenian apartments [60,81]. Results are generalised for the city building stock, based on the latest census [17]. The apartment is considered uninsulated; as stated in paragraph 1.2, most buildings in Athens have been built before the Regulation of the Thermal Insulation of Buildings [18]. The selected scenarios are based on zeroing energy consumption so as to achieve the city’s independency from fossil fuels. Thus, as the trend at national level is to de-carbonise electricity generation, electricity is applied for space heating. Moreover, as analysed in paragraph 1.1, with the temperatures’ trend to rise in the area, the city will face more intense issues with cooling than with heating. Apart from that, the global trend for cities in their carbon neutrality climate action plans, is electric space heating [82–84], which has also been encouraged by several climate action foundations [6,85].
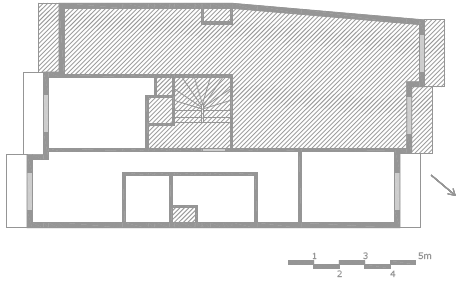
Figure 4 Plan of the examined apartment.
Fourteen scenarios are examined for the energy upgrade of the Athenian residency, as described in Table 3. For the base case scenario (building as is), the building is uninsulated, heated with an oil boiler and cooled with a local air conditioning system. Sanitary Hot Water (SHW) is produced from a local electric heater, with 4kW power. The efficiency of the heating system is considered to be 0.80, and the EER of the cooling system 1.70 [86]. All technologies applied in the examined scenarios are well established in the market. Odd number scenarios focus on the energy upgrade of the building envelope, in which two options are considered: the placement of conventional materials (extruded polystyrene for thermal insulation and aluminum frames with thermal break and low-e, double glazed windows for openings) and of eco-friendly building materials (symbolised as ‘eco’), where kenaf is placed as insulation and timber frames and low-e, double glazed windows for openings. The necessary width of thermal insulation in each case is estimated according to ISO 7345:2018 [87], so as to meet the standards of [88], with thermal conductivity 0.036W/(mK) for the conventional thermal insulation and 0.040W/(mK) for the eco-friendly material. For scenarios where the heating and cooling system is improved with local, ecolabel A/C units (scenarios 4, 5, 5-eco, 6, 7, 7-eco, 9 and 9-eco), COP is set at 6.20 and EER at 4.00. In scenarios where thermal solar collectors are placed for the production of Sanitary Hot Water (scenarios 2, 3, 3-eco, 6, 7, 7-eco, 8, 9 and 9-eco), a flat, selective 5m2 collector is applied. Finally, in scenarios with photovoltaic panels (scenarios 8, 9 and 9-eco), 1 kW (6m2) monocrystalline panels are placed on the building’s roof top vii . Both thermal and photovoltaic solar panels are placed on the building’s roof, facing South, with 45° tilt, not shaded throughout the year. Scenarios 7, 7-eco, 8, 9 and 9-eco convert the dwelling in question into nZEB, based on [89].
Table 3 Short description of examined energy upgrade scenarios for residencies.
As can be observed in Figure 2b, the majority of tertiary sector buildings in Athens are office/retail. So as to examine the tertiary sector, an office building is chosen; a municipal, uninsulated office building, with six floors (Figure 5). It is heated with natural gas and cooled with local A/C units. Similarly, as for residencies, fourteen scenarios are examined, with technologies already established in the market. The same rationale applies in the selection of scenarios as for residencies; odd numbered scenarios involve two types of energy upgrade of the building envelope: with conventional and with eco-friendly materials. For reasons of consistency, the same technical characteristics regarding both building materials and HVAC systems have been applied to both residencies and tertiary sector. The only differences are the replacement of lighting in the office building with LED lights with lighting sensors (Scenarios 2, 3, 3-eco, 6, 7, 7-eco, 8, 9 and 9-eco) and the surface of photovoltaic panels (106m2 – 18kW), which corresponds to the available on the roof top, unshaded space. A brief description of the examined scenarios is given in Table 4. Scenarios 3 and 5–9 convert the building in question into nZEB, according to [89].
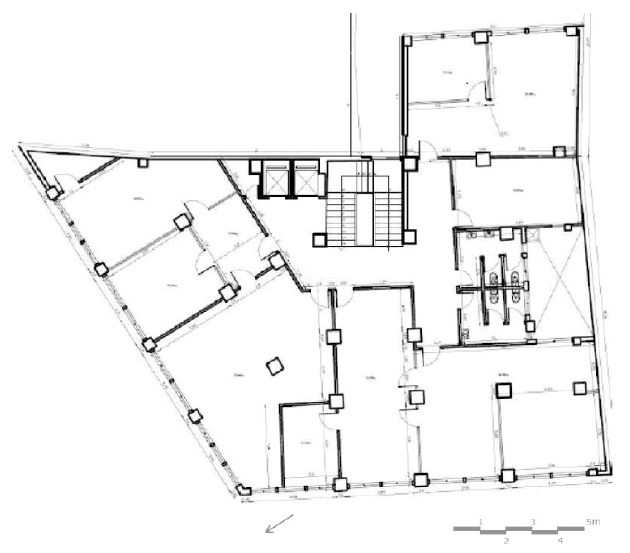
Figure 5 Typical floor plan of the examined office building.
Table 4 Short description of examined energy upgrade scenarios for tertiary sector.
As can be observed in Figure 6, stationary energy (in which buildings are included) has a significant share, of the magnitude of 59%, in the city’s greenhouse gas emissions in 2019. The building stock is responsible for 93% of the energy consumed within the city for stationary purposes and of 57% of the total greenhouse gases emitted by the City of Athens (Figure 6).
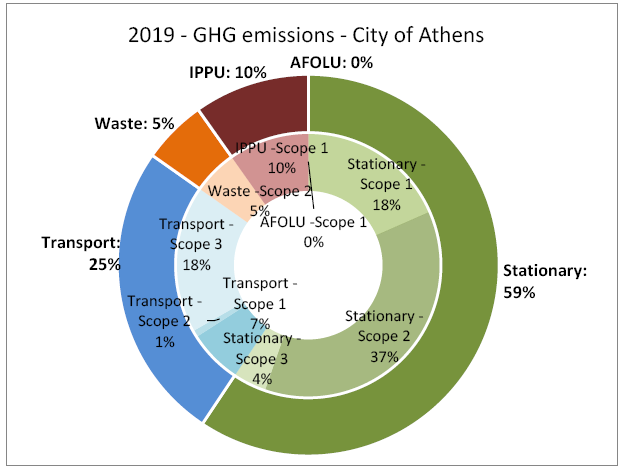
Figure 6 Greenhouse gas emissions in the City of Athens, 2019.
Generally stationary sources tend to be the largest emitters of greenhouse gas emissions in both European and Mediterranean cities (Figure 7), while buildings are the dominant sources of stationary greenhouse gases in Athens. Despite their large volume, as discussed in paragraph 1.2, dwellings are responsible for 31% of the total greenhouse gas emissions from the activities that take place within the city, while buildings of the tertiary sector, which account for a smaller number within the city are, disproportionally, responsible for 26% of the total greenhouse gas emissions in 2019.
Regarding energy consumption in buildings (both residencies and tertiary sector), 45% is due to electricity, 40% due to diesel and 14% due to natural gas in 2019. The trend from 2014 onwards is for diesel oil for heating to decrease and of natural gas to slowly increase (Figure 8), following the tendencies of heating degree days per year (Figure 9). Electrical consumption in residencies has an upward trend, while in the tertiary sector a decreasing trend during the years of austerity, slightly increasing from 2017 onwards (Figure 8). However, the total trend of energy consumption from the building sector in Athens is to increase; it has increased by 7.7% from 2014 to 2019; there have been some local decreases in 2016 and 2018, following the decrease of heating degree days during these years (Figure 9), but the general trend from the existing time series seems to be upward. Generally, there has not been any significant improvement of the energy efficiency of the building stock in Athens; the city has had very small participation in the national programmes of the energy upgrade of dwellings [90]. Nonetheless, the decrease of greenhouse gas emissions from the city’s building sector (Figure 10) has been of the magnitude of 20.9%; this is due to the decarbonisation of electricity production at national scale [26]; GHG emissions factor for electricity in Greece has dropped by 24.5% from 2014 to 2019 (Figure 3). In order not only to decrease greenhouse gas emissions, but also the city’s energy demand, it is mandatory to put forward energy saving solutions that can be applied rapidly throughout the Athenian building stock. Generally, as mentioned above, the electrification of heating and cooling is advocated as the pathway towards carbon neutral buildings [6,85]. However, as electricity now is responsible for more than 3 times higher GHG emissions than natural gas (Figure 3), it would be disastrous to electrify space heating without any efficiency improvement or other energy saving measures.
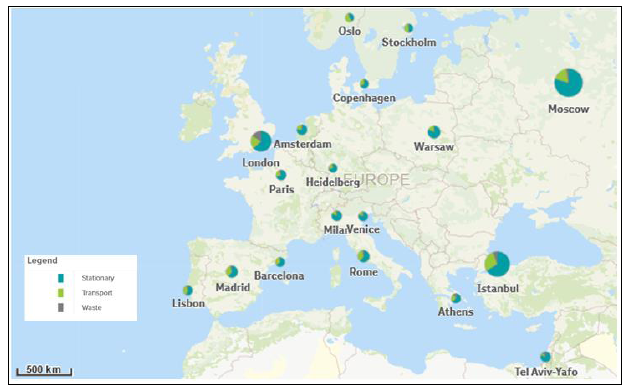
Figure 7 Greenhouse gas emissions per sector in European and Mediterranean cities in 2018 [91].

Figure 8 Time series of electricity, diesel, natural gas and biomass consumed in residential and tertiary sector buildings in the City of Athens.
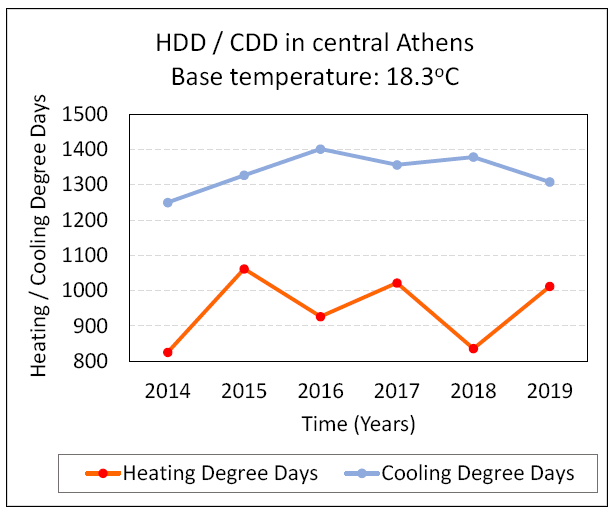
Figure 9 Timeseries of Heating and Cooling Degree Days in Central Athens (data deriving from respective measurements in the Gazi meteorological station - LGB9/National Observatory of Athens: https://meteosearch.meteo.gr/).
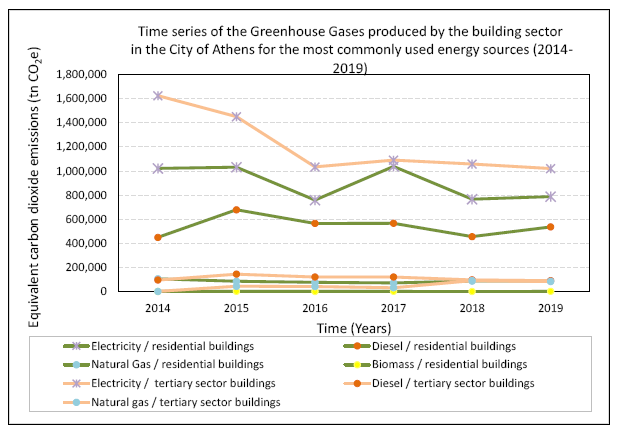
Figure 10 Time series of the greenhouse gases emitted by each source in residential and tertiary sector buildings in the City of Athens.
In Figures 11 and 12 the energy intensity of the base case (Scenario 0 – building as is) and all examined scenarios are shown for the residential and the tertiary sector building, respectively. This energy intensity seems quite high; the monitored average energy intensity for the Athenian residency from the time series 2014–2019 is of the magnitude of 117.7kWh/m2, while the estimated one for the selected apartment is 178.9kWh/m2, 34% larger. According to national assumptions [86], the energy simulation of a residency does not take into account the energy consumption due to artificial lighting or appliances, including cooking, although the assumptions on the energy use are quite high, in comparison to reality [92]. Similarly, appliances, cooking and other energy consuming activities are not taken into consideration in tertiary sector buildings. It has been pointed out by Balaras et al. [93] that the estimated energy consumption of buildings according to these national assumptions is 44% higher than the monitored one. For this reason, the energy consumption calculated according to national standards is assumed to be the total energy consumption of the examined buildings. It is interesting, however, that by extrapolating the calculated energy consumption to the surface of the buildings in the Municipality of Athens, according to the latest census, the calculated values are 53% higher for the tertiary sector and 34% for residencies than the monitored ones, based on the GPC [22], which is of a similar order of magnitude as the deviation observed by Balaras et al. [93].
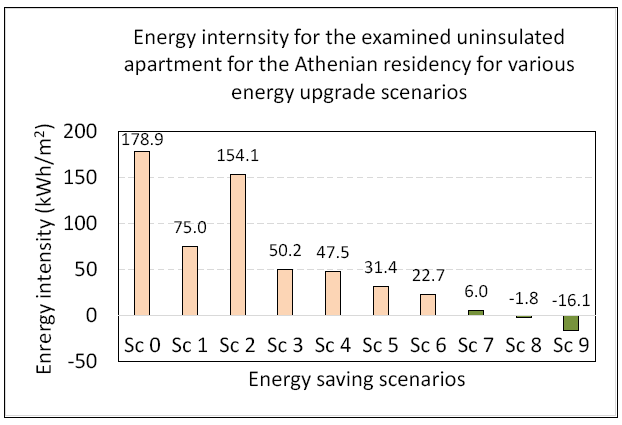
Figure 11 Energy intensity of the examined scenarios for the uninsulated apartment case-studied as the Athenian residency. Scenarios that lead to nZEB are symbolised with green colour.
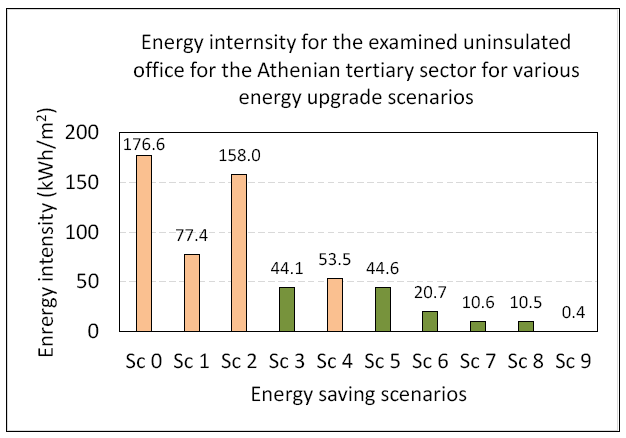
Figure 12 Energy intensity of the examined scenarios for the uninsulated office building case-studied as the Athenian tertiary sector. Scenarios that lead to nZEB are symbolised with green colour.
The results for each examined criterion and scenario are summarised in Table 4 for residencies and in Table 5 for the tertiary sector. For the implementation of scenarios for the building stock of the whole city, the financial resources depicted in the last columns of Tables 4 and 5 must be secured. As has also been observed by Daskalaki et al. [60,61], energy savings achieved by only upgrading the building envelope are not so great (44.4% energy savings for residencies and 48.5% for tertiary sector for Scenarios 1 and 1-eco), as when performing synergies of the energy upgrade of the building envelope and HVAC systems (64.4% for the residency and 68.2% for the tertiary sector for Scenarios 5 and 5-eco). For residency, it is crucial to not only insulate, but also to cover Sanitary Hot Water needs with solar energy, so as to reach significant energy savings (71.6% for Scenarios 3 and 3-eco). When only Sanitary Hot Water is covered by renewables, without any other interventions, energy savings are marginal in residencies (27.10% - Scenario 2). Although this initial cost is relatively small (1,200€), its payback period is quite large (6.0 years). Similarly, when only lighting is upgraded in the tertiary sector, energy savings are not so significant (24.30% - Scenario 2). Nonetheless, due to the assumed intensive use of artificial lighting in office buildings, it offers a very attractive payback period (1.8 years).
Table 5 Weighting factors for each examined set of sensitivity analysis.
As also argued by Droutsa et al. [45], the most cost-effective scenarios are the ones focusing on the upgrade of HVAC systems; the smallest payback periods are observed for the replacement of the heating/cooling system with an ecolabel one (Scenario 4 – 2.2 years) and the addition to this of a solar collector for Sanitary Hot Water (Scenario 6 - 2.9 years) for the residency. For the tertiary sector, the replacement of lighting (Scenario 2) and the combination of replacement of lighting and of an ecolabel HVAC system (Scenario 6) offer payback periods of the magnitude of 1.8 years and 2.5 years, respectively.
For turning the building into a zero-energy building or marginally positive energy one (Scenarios 9 and 9-eco), it is necessary to intervene on both the building envelope and HVAC systems and to also apply RES on it, a conclusion also reached by many researchers (e.g., [40,94–98]). The more technologies applied, the more expensive the retrofitting becomes; for the residency the most expensive are RES application, in combination with the upgrade of the HVAC system (Scenario 8 – 7,500.00€) and the upgrade of the building envelope with ecological materials (Scenario 1-eco – 5,575.20€), while the synergetic scenario 9-eco (upgrade everything, implementation of solar renewables) reaches an initial cost of 12,995.20€, with 11.30 years payback period for the residency and 513,885.80€, with 10.7 years payback period for the tertiary sector.
Embodied energy payback period is larger for placing conventional building materials on the residency (4.4 years – Scenario 1), than eco-friendly ones (2.9 years – Scenario 1-eco), while it pays off much faster for the tertiary sector, which is more exposed to the external environment (from 0.3 years for eco-friendly materials to 0.6 years for conventional ones for Scenario 1). Scenarios 9 with eco-friendly materials payback fast their embodied energy in both the residency (2.1 years) and the tertiary sector (2.4 years). Photovoltaics and solar panels payback much faster their embodied energy (0.8 years for Scenario 2 and 0.8 years for Scenario 8 for the residency), as has also been observed by Alexandri and Androutsopoulos [41].
In order to prioritise the examined scenarios, in relation to the seven selected criteria, sensitivity analysis is made, regarding the weighting factors of each criterion (Table 5). Before proceeding to the results of this multicriteria analysis, it is interesting to discuss the weighting factors attributed by engineers; energy savings is the most important criterion for them, followed by social (operational cost) and economic (investment cost) criteria. Greenhouse gas emissions do not seem such a decisive criterion for them, while the environmental criteria of embodied energy or the city’s thermal capacity seem rather indifferent. Respective surveys [41,99] have reached similar results.
The Multi Attribute Utility Theory is applied for each set of weighting factors. The first prioritization examined is made with the weighting factors deriving from the engineers and is depicted in Figures 13 and 14 for the residential and the tertiary sector, respectively. Despite the low weighting factor for the embodied energy payback period, Scenario 7-eco (the upgrade of the building envelope with eco-friendly materials, the upgrade of the heating/cooling system, in combination with a solar collector for Sanitary Hot Water) ranks first for the residency; it also turns the building into an n-ZEB, satisfying in an optimum way all seven examined criteria. It is followed by the same scenario with conventional materials (Scenario 7), while the 3rd option is the upgrade of the heating/cooling system, in combination with a solar collector for Sanitary Hot Water without the energy upgrade of the building envelope (Scenario 6, not an n-ZEB scenario). The optimum energy saving scenario (Scenario 9-eco) ranks 4th. Similar ranking is observed when all weighting factors are set equal (Figure 15). As economic criteria are taken into account, such as the initial cost, scenarios that receive a better ranking are not necessarily the ones that lead to the highest rates of energy savings, as has also been commented by Alexandri and Androutsopoulos [41]. It is interesting to observe that leaving the building as is (Scenario 0) is a more preferable option than just placing a solar collector (Scenario 2); Scenario 0 ranks 14th, while Scenario 2 ranks 15th for both equal weighing factors and for the weighting factors from the survey. Taking into account the criteria presented in paragraph 2.1, it is better to keep the building as is, than to perform actions of high embodied energy and relatively high initial cost, that offer low energy savings, which has also been confirmed by Zikou and Alexandri [100].
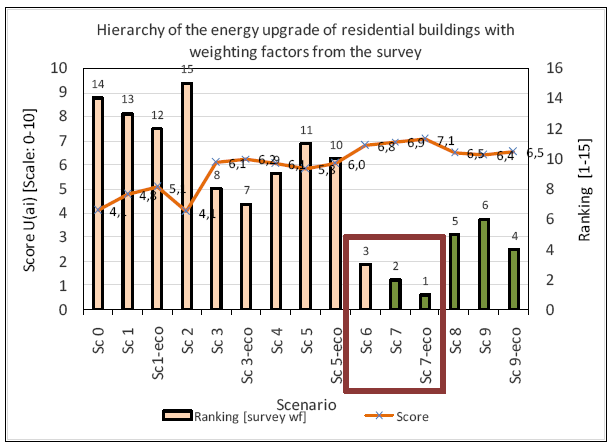
Figure 13 Scenario scores and ranking for the residency for weighting factors deriving from the survey to engineers. Scenarios that lead to nZEB are symbolised with green colour.
For the tertiary sector, the n-ZEB Scenario 3 (combination of the upgrade of the building envelope and replacement of lighting) ranks 1st, followed very closely by Scenario 3-eco, for both the equal weighting factors and the weighting factors from the survey. The also n-ZEB Scenario 8 (replacement of lighting, HVAC system and placement of 18kW photovoltaics) ranks 3rd for the weighting factors from the survey, but 6th for the equal weighting factors; in this case the optimum energy savings examined scenario (Scenario 9) ranks 3rd. Its equivalent scenario with eco-friendly materials (Scenario 9-eco) ranks 7th for the engineers’ weighting factors and 5th for equal weighting factors.
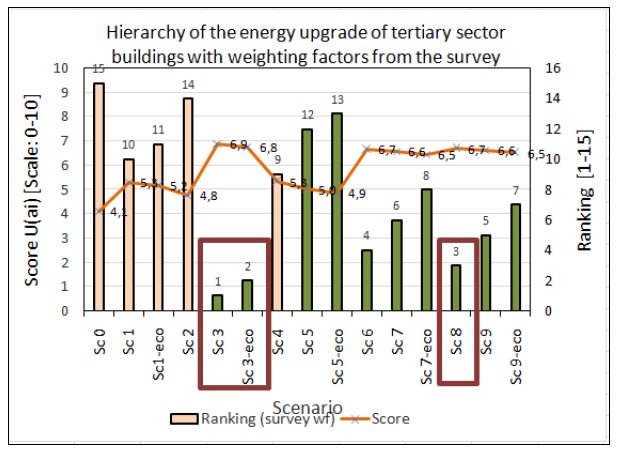
Figure 14 Scenario scores and ranking for the tertiary sector for weighting factors deriving from the survey to engineers. Scenarios that lead to nZEB are symbolised with green colour.
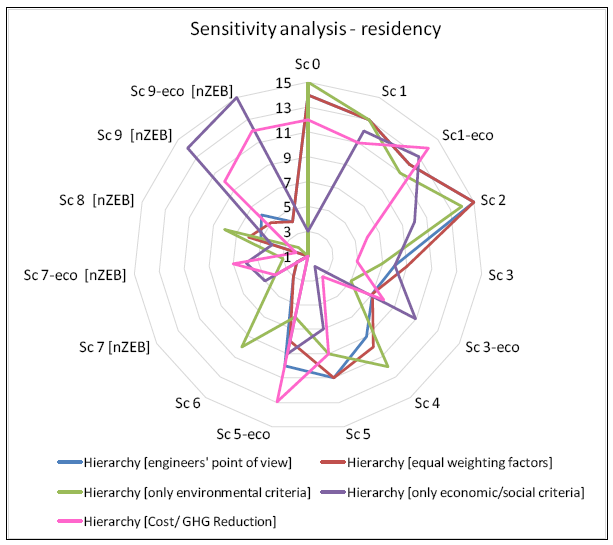
Figure 15 Sensitivity analysis of the hierarchy of scenarios for the residency, according to weighting factors deriving from Table 5.
From this sensitivity analysis (Figures 15 and 16), it can be observed that the ranking of the examined scenarios varies considerably, confirming the complexity of the relationships between sustainability indicators [54]. Nonetheless, some distinctive patterns can be observed; equal weighting factors and survey weighting factors indicate as optimum those energy saving solutions which can offer quite moderate greenhouse gas emissions reduction and energy saving results for relatively low cost and low embodied energy. When only environmental criteria are taken into consideration, eco-friendly materials thrive and so do solutions for the optimum energy upgrade of buildings. When only economic and social criteria are taken into consideration, the most cost-effective scenarios seem the best option, which also offer significant energy savings, as has also been concluded by Mitsiou and Alexandri [99].
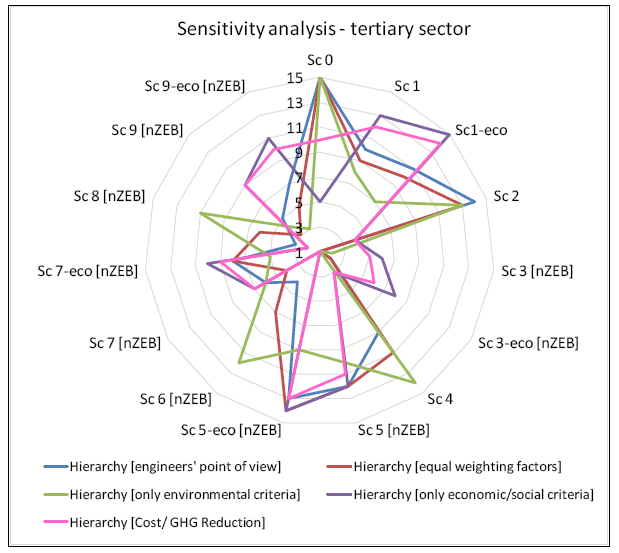
Figure 16 Sensitivity analysis of the hierarchy of scenarios for the tertiary sector, according to weighting factors deriving from Table 5.
Following a pragmatic rationale, the combination of the aim (greenhouse gas emissions reduction) and its main obstacle (initial cost) are investigated in more detail; in Figures 17 and 18, the ranking of this combination is shown, for the residence and the tertiary sector, respectively. From this MAUT analysis, Scenario 6 (replacement of the heating/cooling system and placement of a solar collector) ranks first for the residency and also Scenario 6 (replacement of lighting and HVAC system) for the tertiary sector. As in practice the obstacle (the initial cost) will determine what is implemented, it is further investigated whether this optimum option for these two criteria can lead to a fast transformation of the Athenian building stock into a less polluting sector. The GHG emissions reduction and the costs estimated for the examined apartment and the office building for Scenario 6 are generalised from single units to the whole city’s building stock, according to data on the number of buildings and surfaces from the latest census [17]. The two scenarios are suggested to be implemented within a decade for the whole Athenian building stock, starting from 2023, with 5 years distance (Figure 19). For their implementation, only about 1.3 billion € are needed for dwellings (Table 6) and 1.5 billion € for the tertiary sector (Table 7). For the dynamic estimation of greenhouse gases from electricity, these actions offer a steep decline of greenhouse gas emissions from the building sector, much faster than the linearly considered zeroing up to 2050 (Figure 19); within 15 years, GHG emissions can have been lowered by 94% and the energy demand in the building sector by 79% (lowering to 1,259 GWh). Followed by the upgrade of the building envelope and the placement of photovoltaics considered in Scenarios 9-eco, in the next ten-year horizon, carbon neutrality of Athenian buildings will be a possibility for another 4.3 billion € for dwellings (Table 6) and 5.7 billion € for the tertiary sector (Table 7). With these costs and energy saving measures, in theory, the city building sector is capable to zero its greenhouse gas emissions within the timeframe set for the conversion of cities to carbon neutral by 2050 (Figure 19).
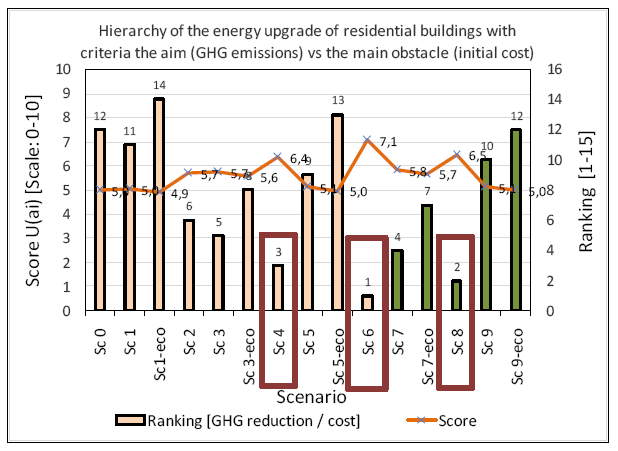
Figure 17 Scenario scores and ranking for the residency for the aim (greenhouse gas emissions reduction) versus the main obstacle (initial cost). Scenarios that lead to nZEB are symbolised with green colour.
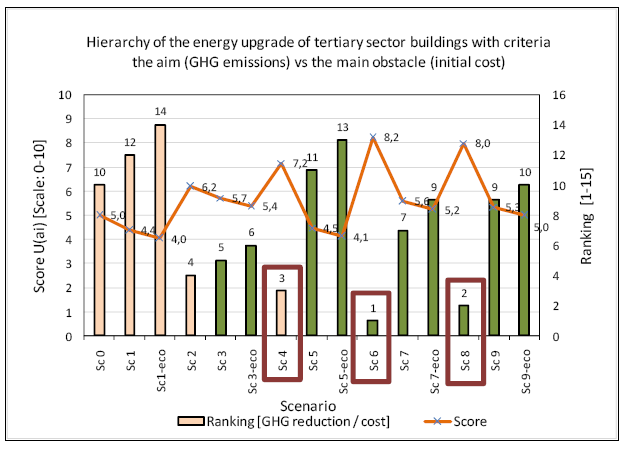
Figure 18 Scenario scores and ranking for the tertiary sector for the aim (greenhouse gas emissions reduction) versus the main obstacle (initial cost). Scenarios that lead to nZEB are symbolised with green colour.
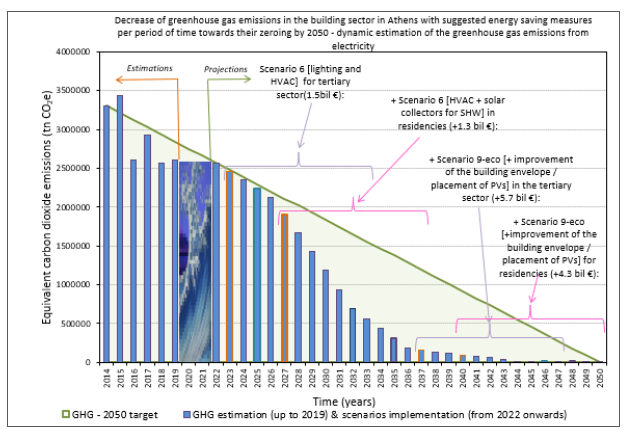
Figure 19 Estimated decrease of greenhouse gas emissions in the Athenian building stock, when applying first Scenario 6 in the tertiary sector, followed by Scenario 6 in the residential sector for fast emissions reduction in a cost-effective manner. The optimum energy upgrade (Scenario 9-eco) is applied from then onwards to both tertiary sector and residential buildings.
Table 6 Results for the seven examined criteria and generalised costs for the city’s residential building stock.
Table 7 Results for the seven examined criteria and generalised costs for the city’s tertiary sector building stock.
The aim of this paper is to pinpoint energy saving measures, which can lead to the conversion of the urban building stock to zero carbon, in a cost-effective way, in line with Sustainable Development Goals. For this reason, the building stock of the City of Athens is examined, with the aim of its carbon neutrality by 2050. Data have been collected on the climatic trends of the area and the characteristics of the building stock. The city’s greenhouse gas emissions as well as the buildings’ contribution in global warming have been estimated. From this analysis, characteristic buildings and their energy upgrade scenarios have been selected, investigating the effect of already established in the market technologies. Criteria from the United Nations Sustainable Development Goals have been selected to examine and to prioritise these energy upgrade scenarios, using the Multi Attribute Utility Theory. It is observed that when criteria from the three pillars of sustainability (environmental protection, economic growth and social equity) are taken into consideration, the most intensive energy saving scenarios are not the most prominent ones, as their high costs are deliberated. From the sensitivity analysis made on the weighting factors of the examined criteria, it has become apparent that, depending on the weighting factor of each criterion, the ranking of the examined technologies changes, due to the complexity of the relationships between sustainability indicators. However, it is clear that eco-friendly materials are preferable solutions for the upgrade of the building envelope, when compared with conventional ones, despite their largest cost. Generally, as the replacement of HVAC systems is less expensive than the upgrade of the building envelope and promisingly efficient, when ecolabel systems are placed, it generally ranks higher than upgrading the building envelope. It is also worth mentioning that when the payback period of embodied energy and investment cost are taken into consideration, it seems better to leave the building as is, instead of taking energy upgrade actions that offer small energy savings, hence contribute to the increase of global GHG emissions.
Based on these observations, the solutions that have been further investigated are the ones that satisfy both the goal (greenhouse gas emissions reduction) and the main obstacle (initial cost). The solutions highlighted by this multicriteria analysis have been the combination of the replacement of HVAC system, with the placement of solar collector for SHW for the residential sector and the replacement of lighting and HVAC system for the tertiary sector. These combinations can result in a rapid decrease of greenhouse gas emissions (94% in 15 years), with only 2,8 billion € initial cost for the city’s building stock. The improvement of the building envelope and the installation of photovoltaic panels can follow in a second phase, as more expensive solutions, necessary for the conversion of the city building stock to carbon neutral.
From this analysis it is proved that the reduction of greenhouse gas emissions from the building sector in the City of Athens, it is important to initially promote (through financial tools, information actions, etc.) the discussed upgrade of HVAC systems and solar applications, and afterwards the upgrade of the building envelope, in combination with the installation of PVs on buildings. It has been proved that the zeroing of GHG emissions from the building sector in Athens can be feasible with existing technologies. However, in practice, the political will to invest money in the near and less near future, in combination with social and economic implications of the pandemic, as well as the structural resilience of these buildings can be serious obstacles in such visions.
Nonetheless, electrification, the advocation of carbon neutral cities is not a panacea; up to date (2019), 29.3% of the total energy consumed in Athens for transport and stationary consumption (10,857 GWh) is electrical. When the rest of the energy for heating spaces and moving vehicles (7,679 GWh) are demanded from electrical generation plans, not only for Athens, but for the whole country, it is doubtful if Renewable Energy Sources will be able to provide the electricity needed to move vehicles and to operate buildings and industries. The implementation of energy saving measures should first be put forward, in order to achieve the reduction of energy consumption. The synergy of local and national efforts to mitigate greenhouse gas emissions is mandatory so as to reach sustainable goals.
Such a proposal, of course, needs further investigation: a more detailed approach of the buildings of the tertiary sector, depending on the use, as well as more detailed consideration of dwelling typologies, are elements that should be taken into account in a more thorough investigation. Finally, in this theoretical analysis, the emissions corresponding to the energy consumed for activities such as cooking or domestic and tertiary sector appliances have not been taken into account, neither the energy improvement of such devices, which should be investigated more analytically in further research.
Not applicable.
Not applicable.
Source where the data supporting the findings are available: https://www.c40knowledgehub.org/s/article/C40-cities-greenhouse-gas-emissions-interactive-dashboard?language=en_US.
Not applicable.
The author has declared that no competing interests exist.
The author is very grateful to Rodolphe Quinn from C40 for his technical support on the city’s inventories.
iThe Global Protocol for Community-Scale Greenhouse Gas Emission Inventories (GPC) [22] is a standard for city-level GHG emissions inventories; it is consistent with the IPCC guidelines, allowing for credible comparison and aggregation of emissions data across timescales and cities around the globe [100].
iiNo data is available on the annual consumption of biomass within the city; however, from air quality measurements in residential areas of the city [101-104], it is obvious that a significant amount of biomass is used within the city during winter period.
iiiCIRIS v.2.4 is an excel-based software, based on the GPC standard [22], designed to calculate and report city greenhouse gas emissions [100].
ivThe survey has been electronic, in google forms (https://forms.gle/trEPMnAbQvFQt3F5A), from 21.03.2021 to 28.09.2021, asking engineers to put a mark directly on each examined criterion, the averaged value of which is transformed into a weighting factor according to Ishizaka and Nemery [105].
vThe assumed values for each component are analytically presented in [72].
viThe reduction of operational costs, as a means of eradicating energy poverty is a social equity criterion for the residency. Nonetheless, it can be considered both a social equity and an economic growth criterion for the tertiary sector.
viiAll together the 11m2 panels / apartment which are placed on the building’s flat roof (5m2 thermal solar collectors and 6m2 photovoltaic panels) is the available area for solar collectors for the specific apartment on the examined building, taking into account the existing structures on the building roof top as well as avoiding the shading of the panels. In practice, this space is not granted on the roof of each residency within the city, taking into consideration the random structures that might exist on rooftops, as well as the private ownership of some roof tops in practice. Generally, available space for solar panels might exist on verandas, where they can act as shading devices, on building façades and balconies, which should be located for each building individually.
| 1. | United Nations. 68% of the world population projected to live in urban areas by 2050. 2018 [cited 2021 Oct 29]. Available from: https://www.un.org/development/desa/en/news/population/2018-revision-of-world-urbanization-prospects.html. |
| 2. | WHO. Climate Change and Health. 2018 [cited 2021 Oct 29]. Available from: https://www.who.int/news-room/fact-sheets/detail/climate-change-and-health. |
| 3. | Stoker TF, Qin D, Plattner G-K, Tignor MMB, Allen SK, Boschung J, Nauels A, Xia Y, Bex V, Midgley PM, editor. Climate Change - The Physical Science Basis Working Group I Contribution to the Fifth Assessment Report of the Intergovernmental Panel on Climate Change. New York: Cambridge University Press; 2013. [Google Scholar] [CrossRef] |
| 4. | United Nations. Cities and pollution. [cited 2021 Oct 29]. Available from: https://www.un.org/en/climatechange/climate-solutions/cities-pollution. |
| 5. | C40. Climate action planning communications toolkit. London: C40; 2020. [Google Scholar] |
| 6. | C40. Defining carbon neutrality for cities & managing residual emissions. 2019 [cited 2021 Oct 29]. Available from: https://www.c40.org/researches/defining-carbon-neutrality-for-cities-managing-residual-emissions. |
| 7. | Intergovernmental Panel on Climate Change. Special Report on Climate Change and Land. 2018 [cited 2021 Oct 29]. Available from: https://www.ipcc.ch/srccl/. |
| 8. | Covenant of Mayors. Signatories’ vision. [cited 2021 Oct 29]. Available from: https://www.covenantofmayors.eu/29-about/objectives-and-scope/15-signatories%E2%80%99-vision.html. |
| 9. | CDP. 95 cities have made the 2021 A List. 2020 [cited 2022 Jan 02]. Available from: https://www.cdp.net/en/cities/cities-scores. |
| 10. | Zerefos C, Repapis C, Giannakopoulos C, Kapsomenakis I, Papanikolaou D, Papanikolamou M. The Climate of Eastern Mediterranean and Greece: Past, Present and Future. In: Drakatos K, Zerefos C, Asimakopoulos D, Giannakopoulos C, Giannopoulos G, Donatos G, editor. The Environmental, Economic and Social Impacts of Climate Change in Greece. Athens: National Bank of Greece; 2011. p.1-135. Greek. [Google Scholar] |
| 11. | Skoula E, Myrivili E, Kakrida O, Agorastou K, Gkinis G, Alexandri E. Action plan for climate change – Part B: Strategy for the adaptation to climate change. Athens: City of Athens; 2017. [Google Scholar] |
| 12. | Daglis IA, Rapsomanikis S, Kourtidis K, Melas D, Papayannis A, Keramitsoglou I, Giannaros T, Amiridis V, Petropoulos G, Georgoulias A, Sobrino JA, Manuta P, Grӧbner J, Paganini M, Bianchi R. Results of the DUE THERMOPOLIS campaign with regard to the urban heat island (UHI) effect in Athens. Proceedings of the ESA Living Planet Symposium Conference, Bergen; 2010 28 June - 2 July 2010; Bergen, Norway. Bergen: European Space Agency Living Planet; 2010. |
| 13. | Kaimaki S, Gkouvatsou E, Perdiou A, Moulatsiotis I, Peppa E, Giannatos G. Preparation of the regional plan for adaptation to the climate change of the Prefecture of Attica. Athens: Prefecture of Attica; 2020. In Greek. [Google Scholar] |
| 14. | Founda D, Katavoutas G, Pierros F. June heat waves: from the exception to normality. 2021 [cited 2021 Oct 29]. Available from: http://magazine.noa.gr/archives/4496. |
| 15. | Santamouris M, editor. Heat-island effect. London: James & James; 2001. [Google Scholar] |
| 16. | Giannaros TM, Melas D, Daglis IA, Keramitsoglou I, Kourtidis K. Numerical study of the urban heat island over Athens (Greece) with the WRF model. Atmos Environ. 2013;73:103-111. [Google Scholar] [CrossRef] |
| 17. | Hellenic Statistic Authority. Building Census 2011. 2015 [cited 2021 Oct 29]. Available from: http://wwwstatisticsgr/documents/20181/1204362/A1601_SKT01_DT_DC_00_2011_01_F_GRpdf/33bc3e1f-ea63-47ec-93b8-a96179b2ee59. |
| 18. | Decree on the Approval of the Regulation for the Thermal Insulation of Buildings. Athens: National Printing Office; 1979. Government Gazette 362/Δ/04071979. [Google Scholar] |
| 19. | EUROSTAT. Housing statistics. 2019 [cited 2020 Feb 13]. Available from: https://ec.europa.eu/eurostat/statistics-explained/index.php?title=Housing_statistics. |
| 20. | City of Athens. Redefining the City - Athens Resilience Strategy 2030. Athens: 100 Resilient Cities; 2016. [Google Scholar] |
| 21. | Athens City Council Decision No 1131/22.07.2014 on the Approval for the City of Athens to participate in the Covenant of Mayors for local sustainable energy. Athens; City of Athens. 2014. [Google Scholar] |
| 22. | WRI, C40, ICLEI. Greenhouse Gas Protocol: Global protocol for community-scale greenhouse gas emission inventories—An accounting and reporting standard for cities. 2014 [cited 2021 Oct 29]. Available from: https://ghgprotocol.org/greenhouse-gas-protocol-accounting-reporting-standard-cities. |
| 23. | CDP. General information. 2021 [cited 2021 Oct 29]. Available from: https://www.cdp.net/en/guidance/guidance-for-cities#11-info. |
| 24. | C40. CIRIS User Guide. 2020 [cited 2021 May 15]. Available from: https://cdnlocomotiveworks/sites/5ab410c8a2f42204838f797e/content_entry5ab410fb74c4833febe6c81a/5ad4b9b674c4837def5d3b04/files/CIRIS_User_Guide_v12pdf?1591785253. |
| 25. | C40. City Inventory Reporting and Information System (CIRIS v.2.4). 2021 [cited 2021 May 15]. Available from: https://wwwc40knowledgehuborg/s/article/City-Inventory-Reporting-and-Information-System-CIRIS?language=en_US. |
| 26. | NIR-National Inventory Report Greece. Climate Change Emissions Inventory – Annual inventory submission of Greece under the convention Kyoto Protocol for greenhouse and other gases for the years 1990-2019. Athens: Ministry of Environment and Energy; 2021. [Google Scholar] |
| 27. | Decision on the Approval of the national plan for energy and climate - Decision No 4 (Government Gazette 4893/Β/31.12.2019). Athens: National Printing Office; 2019. In Greek. [Google Scholar] |
| 28. | Ayoub N, Musharavati F, Pokharel S, Gabbar HA. Energy consumption and conservation practices in Qatar—a case study of a hotel building. Energ Buildings. 2014;84:55-69. [Google Scholar] [CrossRef] |
| 29. | Charles A, Maref W, Ouellet-Plamondon CM. Case study of the upgrade of an existing office building for low energy consumption and low carbon emissions. Energ Buildings. 2019;183:151-160. [Google Scholar] [CrossRef] |
| 30. | Chedwal R, Mathur J, Agarwal G D, Dhaka S. Energy saving potential through energy conservation building code and advance energy efficiency measures in hotel buildings of Jaipur City, India. Energ Buildings. 2015;92:282-295. [Google Scholar] [CrossRef] |
| 31. | Katafygiotou MC, Serghides DK. Analysis of structural elements and energy consumption of school building stock in Cyprus: Energy simulations and upgrade scenarios of a typical school. Energ Buildings. 2014;72:8-16. [Google Scholar] [CrossRef] |
| 32. | Lowry G. Energy saving claims for lighting controls in commercial buildings. Energ Buildings. 2016;133:489-497. [Google Scholar] [CrossRef] |
| 33. | Semprini G, Gulli R, Ferrante A. Deep regeneration vs shallow renovation to achieve nearly zero energy in existing buildings: energy saving and economic impact of design solutions in the housing stock of Bologna. Energ Buildings. 2017;156:327-342. [Google Scholar] [CrossRef] |
| 34. | Dombi M, Kuti I, Balogh P. Sustainability assessment of renewable power and heat generation Technologies. Energ Policy. 2014;67:264-271. [Google Scholar] [CrossRef] |
| 35. | Jovanovic M, Afgan N, Bakic V. An analytical method for the measurement of energy system sustainability in urban areas. Energy. 2010;35:3909-3920. [Google Scholar] [CrossRef] |
| 36. | Stein EW. A comprehensive multi-criteria model to rank electric energy production technologies. Renew Sust Energ Rev. 2013;22:640-654. [Google Scholar] [CrossRef] |
| 37. | Tsoutsos T, Drandaki M, Frantzeskaki N, Iosifidis E, Kiosses I. Sustainable energy planning by using multi-criteria analysis application in the island of Crete. Energ Policy. 2009;37(5):1587-1600. [Google Scholar] [CrossRef] |
| 38. | Rahman M, Paatero JV, Lahdelma R. Evaluation of choices for sustainable rural electrification in developing countries: a multicriteria approach. Energ Policy. 2013;59:589-599. [Google Scholar] [CrossRef] |
| 39. | Pesola A, Serkkola A, Lahdelma R, Salminen P. Multicriteria evaluation of alternatives for remote monitoring systems of municipal buildings. Energ Buildings. 2014;72:229-237. [Google Scholar] [CrossRef] |
| 40. | Mokhtara C, Negrou B, Settou N, Gouareh A, Settou B. Pathways to plus-energy buildings in Algeria: design optimization method based on GIS and multi-criteria decision-making. Enrgy Proced. 2019;162:171-180. [Google Scholar] [CrossRef] |
| 41. | Alexandri E, Androutsopoulos A. Multicriteria evaluation of ecolabels for the energy upgrade of dwellings in Greece. Int J Sustain Energy. 2020;39(1):67-87. [Google Scholar] [CrossRef] |
| 42. | Arroyo P, Mourgues C, Flager F, Correa MG. A new method for applying choosing by advantages (CBA) multicriteria decision to a large number of design alternatives. Energ Buildings. 2018;167:30-37. [Google Scholar] [CrossRef] |
| 43. | Avgelis A, Papadopoulos AM. Application of multicriteria analysis in designing HVAC systems. Energ Buildings. 2009;41(7):774-780. [Google Scholar] [CrossRef] |
| 44. | Alexandri E. MAUT for the Energy Upgrade of Dwellings. Mendeley Data. 2019. [Google Scholar] [CrossRef] |
| 45. | Droutsa KG, Kontoyiannidis S, Dascalaki EG, Balaras CA. Ranking cost effective energy conservation measures for heating in Hellenic residential buildings. Energ Buildings. 2014;70:318-332. [Google Scholar] [CrossRef] |
| 46. | United Nations General Assembly. Transforming our World: the 2030 Agenda for Sustainable Development. 2015. A/RES/70/1. |
| 47. | United Nations. Report of the World Commission on Environment and Development: Our Common Future. 1987. Report No.: A/42/427. |
| 48. | Bouzarovski S. Energy Poverty – (Dis)assembling Europe’s infrastructural divide. Cham: Palgrave Macmillan – Springer Nature; 2018. [Google Scholar] |
| 49. | Scarpellini S, Rivera-Torres P, Suárez-Perale I, Aranda-Usón A. Analysis of energy poverty intensity from the perspective of the regional administration: empirical evidence from households in Southern Europe. Energ Policy. 2015;86:729-738. [Google Scholar] [CrossRef] |
| 50. | Boemi S-N, Papadopoulos A, Panaras G. Research of the energy behavior of households in north Greece – The phenomenon of energy poverty. Proceedings of the 11th National Conference on Renewable Energy Sources; 2018 2018 March 15; Thessaloniki, Greece. Thessaloniki: Institute for Solar Technology; 2018. In Greek. |
| 51. | Papada L, Kaliampakos D. Measuring energy poverty in Greece. Energ Policy. 2016;94:157-165. [Google Scholar] [CrossRef] |
| 52. | Vatavali F, Chatzikonstantinou E. Mapping Energy Poverty in Athens in Crisis. In: Maloutas T, Spyrellis S, editor. Social Atlas of Athens. Athens: Athens Social Atlas; 2016. [Google Scholar] |
| 53. | Hák T, Janoušková S, Moldan B. Sustainable Development Goals: A need for relevant indicators. Ecol Indic. 2016;60:565-573. [Google Scholar] [CrossRef] |
| 54. | Bell S, Morse S. Sustainability Indicators: Measuring the Immeasurable?. 2nd ed. London: Routledge; 2012. [Google Scholar] |
| 55. | Korovesi A, Metaxa K, Touloupaki E, Chrysogelos N. Energy Poverty in Greece. Thessaloniki: Heinrich Böll Foundation of Greece; 2017. [Google Scholar] |
| 56. | Coscieme L, Mortensen, LF, Anderson S, Ward J, Donohue I, Sutton, PC. Going beyond Gross Domestic Product as an indicator to bring coherence to the Sustainable Development Goals. J Clean Prod. 2020;248:119232. [Google Scholar] [CrossRef] |
| 57. | TEE KENAK software v1.29.19. Athens: Technical Chamber of Greece; 2019. [Google Scholar] |
| 58. | Aravantinos D, Vourliotis P, Daskalaki E, Doulos L, Droutsa K, Efthymiadis A, Theodosiou T, Karellas S, Koras G, Laskos K, Mantas D, Balaras CA, Mparmparitsas N, Pallis P, Pantelidis G, Petroliagki M, Tsikaloudaki K. Instructions, Forms for the Reports of the Energy Audits of Buildings, Heating Systems and Air Conditioning Systems. TOTEE 20701-4, Technical Chamber of Greece. Athens: National Printing Office; 2017. (Government Gazette 4003/Β/17.11.2017). [Google Scholar] |
| 59. | Dascalaki EG, Balaras CA, Kontoyiannidis S, Droutsa KG. Modeling energy refurbishment scenarios for the Hellenic residential building stock towards the 2020 & 2030 targets. Energ Buildings. 2016;132:74-90. [Google Scholar] [CrossRef] |
| 60. | Dascalaki EG, Droutsa KG, Balaras CA, Kontoyiannidis S. Building Typologies as a tool for assessing the energy performance of residential buildings–a case study for the Hellenic building stock. Energ Buildings. 2011;43(12):3400-3409. [Google Scholar] [CrossRef] |
| 61. | Dascalaki EG, Kontoyiannidis S, Balaras CA, Droutsa KG. Energy certification of Hellenic buildings: first findings. Energ Buildings. 2013;65:429-437. [Google Scholar] [CrossRef] |
| 62. | Droutsa KG, Kontoyiannidis S, Dascalaki EG, Balaras CA. Mapping the energy performance of Hellenic residential buildings from EPC (energy performance certificate) data. Energy. 2016;98:284-295. [Google Scholar] [CrossRef] |
| 63. | Mitsopoulos G, Bellos E, Tzivanidis C. Parametric Analysis and Multi-Objective Optimization of a Solar Heating System for Various Building Envelopes. Therm Sci Eng Prog. 2018;8:307-317. [Google Scholar] [CrossRef] |
| 64. | Regulation on the descriptive works invoices for public works contracts. Athens: National Printing Office; 2017. Decision NoΔΝSγ/οικ35577/ΦΝ466/2017 (Government Gazette 1746/Β/19.05.2017). [Google Scholar] |
| 65. | Intergovernmental Panel on Climate Change. 2019 Refinement to the 2006 IPCC Guidelines for National Greenhouse Gas Inventories. 2019 [cited 2021 Oct 29]. Available from: https://www.ipcc.ch/report/2019-refinement-to-the-2006-ipcc-guidelines-for-national-greenhouse-gas-inventories/. |
| 66. | Berge B. The Ecology of Building Materials. 2nd ed. Amsterdam: Architectural Press; 2009. [Google Scholar] |
| 67. | Oliva J-P, Courgey S. L’Isolation Thermique Écologique. Mens: Terre Vivante; 2011. In French. [Google Scholar] |
| 68. | Hammond G, Jones C. Inventory of Carbon & Energy (ICE) version 2.0. 2011 [cited 2021 Oct 29]. Available from: https://www.carbonsolutions.com/Resources/ICE%20V2.0%20-%20Jan%202011.xls. |
| 69. | Arnold D. Minimising Life Cycle Cost and Energy Use Emissions in PFI Projects In Presentation prepared for the 2004 September CIBSE National Conference. London: CIBSE; 2004. [Google Scholar] |
| 70. | Lamnatou C, Notton G, Chemisana D, Cristofari C. Life cycle analysis of a building-integrated solar thermal collector, based on embodied energy and embodied carbon methodologies. Energ Buildings. 2014;84:378-387. [Google Scholar] [CrossRef] |
| 71. | Souliotis M, Arnaoutakis N, Panaras G, Kavga A, Papaefthimiou S. Experimental study and Life Cycle Assessment (LCA) of hybrid photovoltaic/thermal (PV/T) solar systems for domestic applications. Renew Energ. 2018;126:708-723. [Google Scholar] [CrossRef] |
| 72. | Alexandri E, Androutsopoulos A. Energy upgrade of existing dwellings in Greece; embodied energy issues. Procedia Environ Sci. 2017;38C:196-203. [Google Scholar] [CrossRef] |
| 73. | Google EIE Tool. Environmental Insights Explorer - City of Athens. 2021 [cited 2021 Oct 29]. Available from: https://partnerdash.google.com/apps/environmental-insights/places/ChIJ8UNwBh-9oRQR3Y1mdkU1Nic. |
| 74. | Kusaka H, Kimura F. Thermal effects of urban canyon structure on the nocturnal heat island: Numerical experiment using a mesoscale model coupled with an urban canopy model. J Appl Meteorol. 2004;43(12):1899-1910. [Google Scholar] [CrossRef] |
| 75. | He BJ. Potentials of meteorological characteristics and synoptic conditions to mitigate urban heat island effects. Urban Clim. 2018;24:26-33. [Google Scholar] [CrossRef] |
| 76. | Davies RE, Knappenberger PC, Novicoff WM, Michaels PJ. Decadal changes in summer mortality in U.S. cities. Int J Biometeorol. 2003;47:166-175. [Google Scholar] [CrossRef] |
| 77. | Kovats, RS, Hajat S. Heat stress and public health: a critical review. Annu Rev Publ Health. 2008;29:41-55. [Google Scholar] [CrossRef] |
| 78. | Athienitis AK, Liu C, Hawes D, Banu D, Feldman D. Investigation of the thermal performance of a passive solar test-room with wall latent heat storage. Build Environ. 1997;32(5):405-410. [Google Scholar] [CrossRef] |
| 79. | Salat S. Energy loads, CO2 emissions and building stocks: morphologies, typologies, energy systems and behavior. Build Res Inf. 2009;37(5-6):598-609. [Google Scholar] [CrossRef] |
| 80. | Golbazi M, Aktas CB. Energy efficiency of residential buildings in the US: Improvement potential beyond IECC. Build Environ. 2018;142:278-287. [Google Scholar] [CrossRef] |
| 81. | Institut Wohnen und Umwelt. Typology Approach for Building Stock Energy Assessment. IEE Project TABULA; 2012 Contract No IEE/08/49. Available from: http://webtool.building-typology.eu/?c=gr#bm. |
| 82. | Ajutament de Barcelona. Climate Plan 2018-2030. Barcelona: City of Barcelona; 2018. [Google Scholar] |
| 83. | City of Amsterdam. New Amsterdam Climate – Roadmap Amsterdam climate neutral 2050. Amsterdam: Municipality of Amsterdam; 2020. [Google Scholar] |
| 84. | Mairie de Paris. Paris Action Plan – towards a carbon neutrality city and 100% renewable energies. Paris: Municipality of Paris; 2018. [Google Scholar] |
| 85. | Arikan Y, Carreño C, van Staden M. ICLEI’s climate neutrality framework. 2020 [cited 2021 Oct 29]. Available from: https://e-lib.iclei.org/publications/ICLEIs_Climate_Neutrality_Framework.pdf. |
| 86. | Androutsopoulos A, Aravantinos D, Gonis N, Dimoudi A, Doulos A, Droutsa K, Efthymiadis A, Theodosiou T, Karaoulis A, Karellas S, Katsaros M, Katsimichas S, Mandilaras I, Mantas D, Balaras CA, Pallis P, Pantelidis G, Rigopoulos P, Sarafinos D, Tsikaloudaki K, Tsoka S. Analytic National Specifications of the Parameters for the Calculation of the Energy Performance of Buildings and the Issue of the Energy Certificate of Buildings TOTEE 20701-1. Athens: Technical Chamber of Greece / National Printing Office; 2017. (Government Gazette 4003/Β/17.11.2017). [Google Scholar] |
| 87. | ISO 7345:2018. Thermal performance of buildings and building components — Physical quantities and definitions. Geneva: International Organization for Standardization; 2018. [Google Scholar] |
| 88. | Decision on the Approval of the Regulation on the Energy Efficiency of Building. Athens: National Printing Office; 2017. Decision No ΔΕΠΕΑ/οικ 178581/2017 (Government Gazette 2367/Β/12.07.2017). [Google Scholar] |
| 89. | Decision on the Approval of a national plan for increasing the number of buildings with nearly zero energy consumption - Decision No ΥΠΕΝ/ΔΕΠΕΑ/85251/242 (Government Gazette No 5447/B/05.12.2018). Athens: National Printing Office; 2018. In Greek. [Google Scholar] |
| 90. | Christoforaki K. The spatial and social footprint of the programme “Save at Home” in Metropolitan Athens. 2018 [cited 2021 Oct 29]. Available from: https://wwwathenssocialatlasgr/άρθρο/εξοικονόμηSη-κατ’-οίκον30032021. |
| 91. | C40. Greenhouse gas emissions interactive dashboard. 2021 [cited 2021 Sep 15]. Available from: https://wwwc40knowledgehuborg/s/article/C40-cities-greenhouse-gas-emissions-interactive-dashboard?language=en_US. |
| 92. | Alexandri E. User behaviour and assumptions that affect the energy performance of buildings; comparison with in situ measurements. Proceedings of the 5th International Renewable and Clean Energy Conference; 2014 2013 October 3; Yerevan, Armenia. Yerevan: IREC; 2014. |
| 93. | Balaras CA, Dascalaki EG, Droutsa KG, Kontoyiannidis S. Empirical assessment of calculated and actual heating energy use in Hellenic residential buildings. Appl Energ. 2016;164:115-132. [Google Scholar] [CrossRef] |
| 94. | Tsalikis G, Martinopoulos G. Solar energy systems potential for nearly net zero energy residential buildings. Sol Energy. 2015;115:743-756. [Google Scholar] [CrossRef] |
| 95. | Kolokotsa DEKD, Rovas D, Kosmatopoulos E, Kalaitzakis K. A roadmap towards intelligent net zero- and positive-energy buildings. Solar Energy. 2011;85(12):3067-3084. [Google Scholar] [CrossRef] |
| 96. | Cole RJ, Fedoruk L. Shifting from net-zero to net-positive energy buildings. Build Res Inf. 2015;43(1):111-120. [Google Scholar] [CrossRef] |
| 97. | Magrini A, Lentini G, Cuman S, Bodrato A, Marenco L. From nearly zero energy buildings (NZEB) to positive energy buildings (PEB): The next challenge - The most recent European trends with some notes on the energy analysis of a forerunner PEB example. DIBE. 2020;3:100019. [Google Scholar] [CrossRef] |
| 98. | Synnefa A, Vasilakopoulou K, Kyriakodis GE, Lontorfos V, De Masi RF, Mastrapostoli E, Karlessi T, Santamouris M. Minimizing the energy consumption of low income multiple housing using a holistic approach. Energ Buildings. 2017;154:55-71. [Google Scholar] [CrossRef] |
| 99. | Mitsiou E, Alexandri E. From energy savings to sustainability; how should school buildings be energy upgraded in a sustainable way? Proceedings of the 7th International Renewable and Clean Energy Conference; 2021 2020 November 27; Yerevan, Armenia. Yerevan: IREC; 2021. |
| 100. | Zikou A, Alexandri E. Multicriteria analysis of the energy upgrade of a heritage, office building. Proceedings of the 12th International Conference on Energy and Climate Change; 2020 2019 October 10; Athens, Greece. Athens: KEPA; 2020. |
| 101. | Bailey J, Gerasopoulos E, Rojas-Rueda D, Benmarhnia T. Potential health and equity co-benefits related to the mitigation policies reducing air pollution from residential wood burning in Athens, Greece. J Environ Sci Heal. 2019;Part A:1-8. [Google Scholar] [CrossRef] |
| 102. |
Kalogridis AC, Vratolis S, Liakakou E, Gerasopoulos E, Mihalopoulos N, Eleftheriadis K. Assessment of wood burning |
| 103. | Alexandri E. Environmental crimes, police brutality, traffic restrictions and covid-19; effects on the air quality of the City of Athens. Proceedings of the 7th International Renewable and Clean Energy Conference; 2021 2020 November 27; Yerevan, Armenia. Yerevan: IREC; 2021. |
| 104. | Tzima K, Analitis A, Katsouyanni K, Samoli E. Has the risk of mortality related to short-term exposure to particles changed over the past years in Athens, Greece? Environ Int. 2018;113:306-312. [Google Scholar] [CrossRef] |
| 105. | Ishizaka A, Nemery P. Multi-Criteria Decision Analysis. Chichester: Willey & Sons Ltd; 2013. [Google Scholar] |

![]()
Copyright © 2026 Pivot Science Publications Corp. - unless otherwise stated | Terms and Conditions | Privacy Policy