
Green Energy and Sustainability ISSN 2771-1641
Green Energy and Sustainability 2021;1(2):0006 | https://doi.org/10.47248/HKOD902101020006
Original Research Open Access
Design optimization of multi energy systems for domestic hot water uses on the building sector
Vasileios Kilis
1

 ,
Nikolaos Ploskas
2
,
Giorgos Panaras
1
,
Nikolaos Ploskas
2
,
Giorgos Panaras
1
Correspondence: Giorgos Panaras
Academic Editor(s): George Papadakis
Received: Sep 30, 2021 | Accepted: Nov 4, 2021 | Published: Dec 17, 2021
This article belongs to the Special Issue Selected Papers from the 12th National Conference of IHT
© 2021 by the author(s). This is an Open Access article distributed under the terms of the Creative Commons License Attribution 4.0 International (CC BY 4.0), which permits unrestricted use, distribution, and reproduction in any medium or format, provided the original work is correctly credited.
Cite this article: Kilis V, Ploskas N, Panaras G. Design optimization of multi energy systems for domestic hot water uses on the building sector. Green Energy Sustain 2021; 1(2):0006. https://doi.org/10.47248/HKOD902101020006
The burden that has come upon the environment, combined with the ever-declining fossil fuel reserves, has led to the need of reducing the conventional energy consumption in building sector and to the promotion of systems based on Renewable Energy Sources (RES). This paper deals with the optimization of multi energy systems in order to cover the needs of hot water in domestic use. In particular, integer linear programming models are formulated and the optimal solutions regarding the degree of participation of the multi energy systems are explored; economic, energy, and environmental criteria are assumed. The respective mathematical programming approaches include linear objective functions, multiple objective functions that either do or do not use weights, as well as goal programming-based ones. The modeling and solution of the problems is done with the General Algebraic Modeling System (GAMS).
The case study refers to residential use; both conventional and RES systems are selected for the respective energy demand coverage. The time step of the analysis is 1 hour, in the context of annual operation. According to the results, in the case of the energy criterion, biomass predominates, or heat pumps, when biomass is not included, with an increase in participation of solar thermal collectors when the environmental criterion is introduced. The participation of solar thermal factor is also reinforced in the case of goal programming, because of the relaxation of the initial targets. The analysis demonstrated that the existing integer linear programming methodological tools can be used for investigating problems of multiple energy systems or comparing subsystems.
Keywordsoptimization, multi energy systems, energy hub, linear programming, domestic hot water, renewable energy systems
One of the most crucial issues worldwide, especially in the last two decades, is the increase of the energy consumption due to the increase of the world population, but also to the economic development. In the European Union (EU-27), according to published data of 2019, it can be seen that the residential building sector is responsible for 26% of the total energy consumption [1]. The EU is particularly concerned with limiting the energy consumption of the building sector, as it is demonstrated by the Energy Performance of Buildings Directive (EPBD) [2] and its recasts, mentioning the most recent one [3]. Moreover, the EU has set ambitious goals to reduce the consumption of primary energy, which is based on fossil fuel, and consequently Carbon Dioxide (CO2) emissions to the atmosphere. A relevant reference goal of EU anticipated that newly constructed buildings should be in compliance with the specifications of near Zero Energy Building (nZEB); a deadline of 31st December 2020 was set. Regarding future prospects, the imposed targets for 2030 refer to: (a) an initial reduction of at least 40% of greenhouse gas emissions, comparing to levels of 1990, (b) an allocation of at least 32% of energy used to the RES and (c) an improvement of at least 32.5% in the energy efficiency of the energy systems used [4].
Covering the energy needs for domestic water heating in the building sector is an important aspect for the total energy consumption of a building, as it is demonstrated by relevant published data [5–7]. More particularly, the energy consumption for heating water in Greek households for 2019, approaches the percentage of 13.3% of the total building energy consumption, while 56.3% of this consumption is for heating, 19.2% is for electricity and electrical appliances, and small percentages of about 6.2% and 4.9% are related to cooking and cooling, respectively [8]. In addition to the above, water heating can be demanding on a financial level, while burdening for the environment; apart from the number of residents/users and the type (use) of the building, its cost and impact are strongly related to the energy system (fuel source) that it is used. Thus, the determination of the optimal solution, given the above parameters and criteria [9,10], can be important for the user, as well as on a local and global level.
In this work, mathematical optimization models, describing the participation rates of energy systems for covering the hot water needs for sanitary use of a household, are formulated. Mathematical optimization modeling is usually implemented in different case studies and its implementation in household energy systems is an innovative aspect [11]. The concept of multi energy systems is introduced, i.e., a group of systems that uses different energy sources [12] but can be used in order to cover the same type of energy demand, forming an energy hub [13]. In literature the establishment and operation of energy hubs is a commonly used aspect, and especially when they are formulated to serve optimization models, whose main objective is the minimizing of energy costs [14,15]. The proposed energy hub is presented in Figure 1, anticipating the presence of the following systems: (a) biomass boiler (wd), (b) oil boiler (bl), (c) electric water heater (el), (d) solar thermal water heater (sol), and (e) an air to water heat pump (hp). Such systems can be considered typical for residential Domestic Hot Water (DHW) in Greece [16–19]. The inputs of the present energy hub refer to the hourly energy demands of DHW (Qdem, DHW), while by introducing the efficiencies (n) and the participation rates (e) of each aforementioned energy systems, the energy consumptions (Qcons, DHW) emerge, which is the output of the energy hub. The case study refers to a house with a total area of 200 m2. Given that, according to the Greek version of the EPBD [20], the area of the building is proportional to the number of residents and to the hot water energy demands, it is indicated that the demonstrated results are not sensitive to the assumed building area. In the proposed analysis, the building has been placed in climatic zones A and D, representing the marginal climatic conditions for the Greek setting [21].

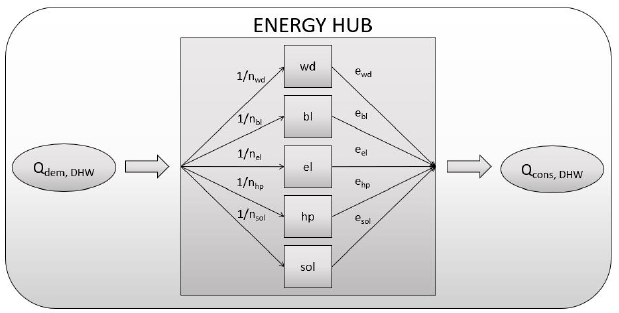
Figure 1 The energy hub of the multi energy system used for DHW uses.
The investigation of the model optimal solution concerns a financial, energy, and environmental criterion. The results of the models used are presented on an hourly basis for the whole operation year of the energy systems and they are obtained by the solver CPLEX.
Overall, the innovation of this study is that mathematical programming models are formed to select the optimal energy system taking into consideration the economic, energy and environmental criteria. What stands out is the low time step used for the model solutions, turning the problem into a dynamic like one, so that the comparison between the examined energy systems and the decision making would be more detailed.
In the following sections, the methodology of developing the proper mathematical models is presented. These models deal with the optimization of the participation rate of each energy system, which is used in covering the demands of DHW. At first, the selection of the appropriate energy systems and the definition of their characteristics, such as their efficiencies or their costs, seems to be critical for the investigation. Afterwards, the description of the basic parameters follows. Such parameters are used in the calculation of the energy loads and consumption, and the installed power of each energy system. Finally, the formulation of the optimization models is analyzed; results and basic conclusions are presented.
COP [-]: the heat pump coefficient of performance calculated per hour.
ΔT[°C]: the temperature difference between the air temperature and the output temperature of the working mean (water), considered at 50 °C [21].
An important aspect that should be mentioned refers to the cost, whether this indicates installation or operational (energy and environmental) one, noting that the environmental factor considers the amount of released CO2, which is the dominant greenhouse gas. The unit cost values are based on market research for typical energy systems and on current prices of providers or suppliers. The values that are used for this investigation are presented in Table 1. In some cases, two values are provided, as in the case of oil and electrical energy; this price diversification was preferred in order to explore the impact of possible economic measures aimed at saving energy in the final solution (e.g., social or night tariff).
QDHW [kWh]: monthly required energy load to cover the needs of DHW.
VW [l/day]: daily volumetric water supply.
Nday,i [days]: number of days of each month.
ρ [kg/m3]: density of water (=1 kg/m3).
cp [kJ/kg K]: water heat capacity (=4.18 kJ/kg K).
TDHW,i [°C]: required temperature of DHW (=45 °C).
Tw,i [°C]: mains water average monthly temperature [21].
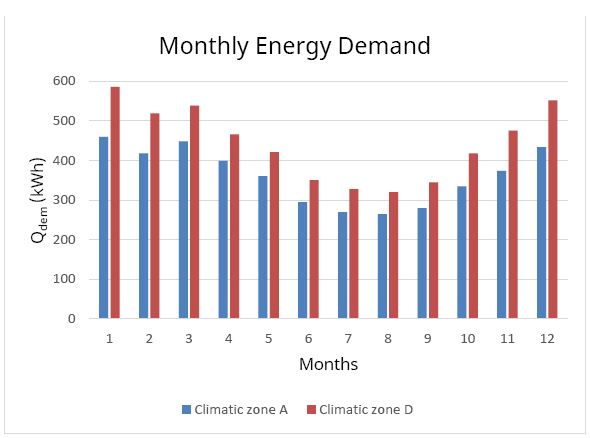
Figure 2 The monthly energy requirement for climatic zones A and D.
From the graph presented in Figure 2, it is obvious that the energy demand in climatic zone D is higher than the ones in A for every month, due to the worst climatic conditions prevailing in the territory of climatic zone D, affecting mains water temperature also. Furthermore, for both climatic zones, the demand towards the summer months is considerably lower than the one towards the winter ones, because of the differences in the temperature of mains water.
Afterwards, depending on the efficiency of each energy system, the energy consumption could be calculated in an hourly basis, according to Equation (3) [20]. Based on these values and the costs presented in Table 1, both energy and environmental costs are calculated.Qdem [kWh]: required energy load (demand).
n or COP [-]: efficiency of each energy system.
Qcons [kWh]: consumed energy.
EsolHW [kWh]: useful energy, provided by the solar collector on monthly basis.
CFsol [-]: capacity factor for the solar energy, i.e., the efficiency of the solar collecting surface, calculated on a monthly basis (=0.4) [20].
nsol [-]: efficiency of heat transfer (=0.95).
Asol [m2]: solar thermal collector area.
Hsol [kWh/m2]: monthly available solar radiation on collectors’ surface [21].
As mentioned above, Equation (5) is the objective function of the mathematical model and includes decision variables, that are used for its optimization, focusing on (or aiming to) minimizing the costs. These variables are the following:
ebl, ewd, eel, ehp, esol: the percentage decision variables that express the participation rate of each energy system.
a, b, c, d: the binary decision variables of each energy system that define the installation costs.
Of course, it is necessary to formulate constraints for the above variables. Their formula and interpretation are described below.
Non-negativity constraints of the participation rates.
Constraint for full covering the demands.
Constraints for the participation of the installation costs.
The basic scenario of the present model refers to the complete case, as described through Equations (5) – (8) in Section 2.2, implemented for both climatic zones, A and D. Following, the energy hub excluding the biomass boiler has also been investigated, as the biomass solution is not so widely used for DHW in Greece.
Figure 3 displays a histogram for the annual optimal energy cost consumed by each energy system of the energy hub, fully covering the DHW demands. These costs were depicted from the hourly solution of the energy optimization model for both climatic zones. So, it can be seen that a building located in climatic zone D consumes more energy, when compared to the case of climatic zone A. This can be explained because of the unfavorable climatic conditions prevailed in climatic zone D, leading to the selection of different participation rate from each energy system. Moreover, Figure 3 shows that the most preferred energy system for both climatic zones is the biomass boiler, due to its low energy cost, and followed by the heat pump for climatic zone D and the solar thermal system for climatic zone A. It is important to mention that the use of systems that collect solar energy, which is considered as a RES system, is favored for both climatic zones, presenting higher participation rate for climatic zone A due to the higher solar energy potential.
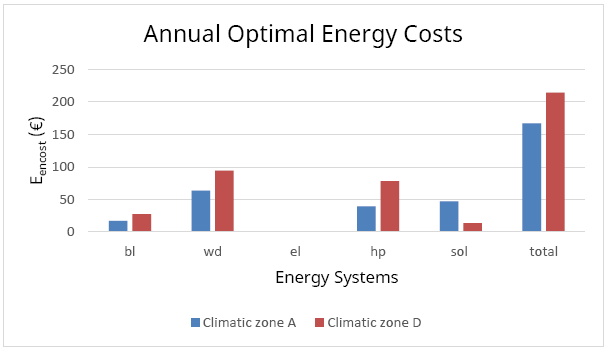
Figure 3 Total annual cost for each energy system, for climatic zones A and D.
In Figure 4, the operational time fraction, on annual basis, of each energy system is presented. It could be stated that the heat pump is dominant for both the climatic zones, followed by biomass in climatic zone D and solar thermal system in climatic zone A. The operational time of the heat pump remains the same, presenting the greatest fraction, for both climatic zones, in comparison with the other energy systems due to the low energy cost; the assumption of the social-night tariff is applied. Despite the fact that these low energy cost values are the same for the electric energy system, its energy consumption and, consequently, its operational costs are higher than those of the heat pump.
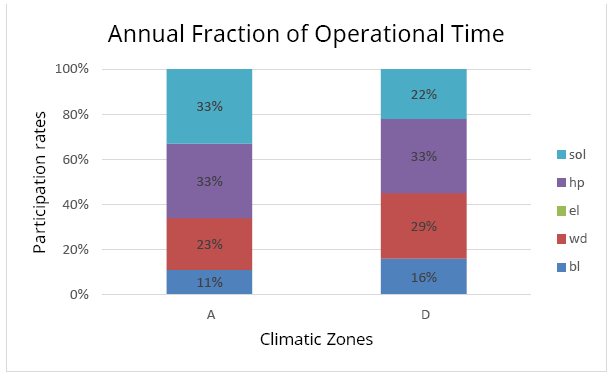
Figure 4 Fraction of the operational time, on annual basis, for each energy system and for both climatic zones.
The above can be verified and further analyzed through the monthly fraction of the operational time. As it can be seen through Figure 5 and Figure 6, for both climatic zones, the biomass boiler is dominant during the winter months, but solar thermal collectors have higher participation during summer months; heat pump operation is almost constant for every month.
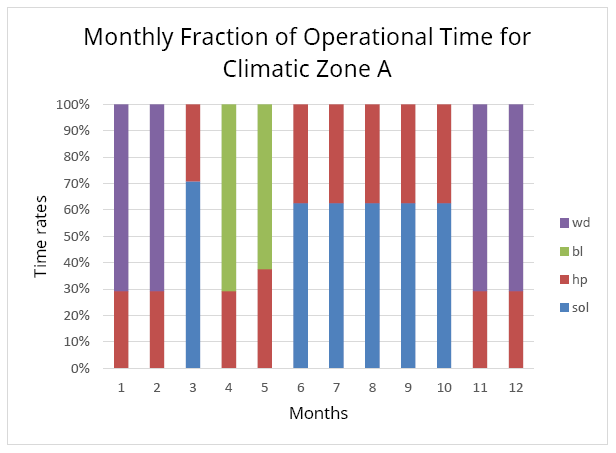
Figure 5 The monthly fraction of the operational time for climatic zone A.
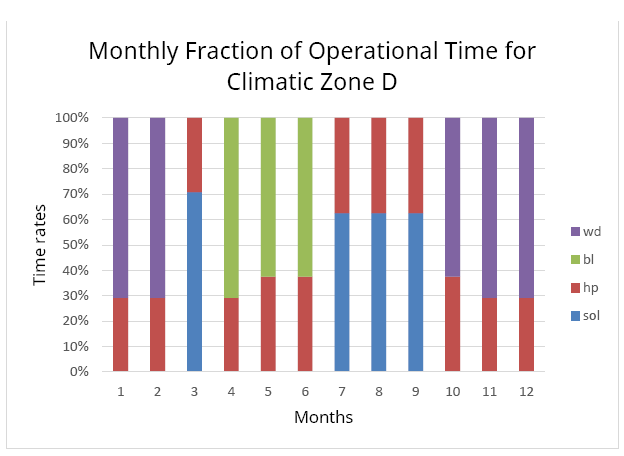
Figure 6 The monthly fraction of the operational time for climatic zone D.
The additional examined energy model is that of excluding the biomass energy system. Results show that there is an increase in total minimized costs by 12% annually, due to the low cost of biomass. This occurs because the participation rate of biomass is primarily shared by the heat pump and the solar thermal collector.
The results of this optimization model show that the RES (wd and sol) is the optional solution for minimizing the environmental cost for the two climatic zones. Considering the model that excludes biomass, solar thermal collectors dominate 100%.
The multi criteria model has been applied for climatic zone D, while not including the biomass boiler presence in the energy hub. The following results are obtained in Table 2, for the three types of models developed. According to these results, the participation of the oil and electrical boiler is not beneficial, so the cost minimization is succeeded only by the participation of the heat pump and the solar thermal collector. Regarding the weightless model, it should be mentioned that the total optimized cost is 40% less than the cost of the basic energy model due to the environmental consequences of the conventional energy systems, such as the electrical boiler.
Table 2 Annual minimized cost for the multi energy models.

The diagram in Figure 7 presents the fraction of the operational time for each energy system for multi criteria models. The results of the weighted models presented both in Table 2 and Figure 7 show that when the more importance is given to the energy criterion, the total cost increases, and the participation of RES systems decreases.
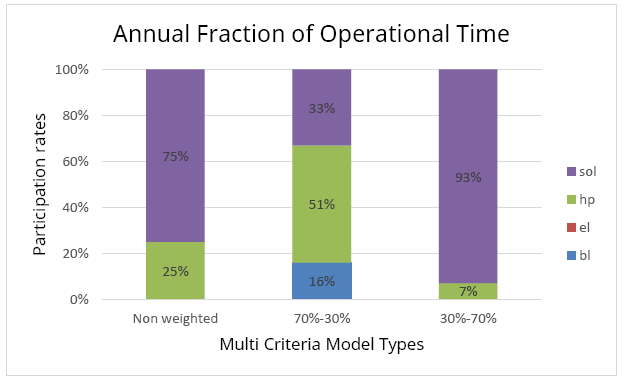
Figure 7 The annual distribution of the operational time for each energy system for the multi criteria models.
Figure 8 presents a histogram of the total annual optimized cost resulting from the solution in an hourly basis of the GP models. Two model types are examined, the classic GP model that includes the energy and the environmental criterion equally (without weights) and the weighted GP model, considering that the energy criterion is twice as important as the environmental one. Figure 8 displays the optimal costs distributed to the two examined criteria and the total costs for both GP models. As in the case of multi criteria, the GP model investigation has not included biomass energy system, due to it being applied into climatic zone D only. According to the results, it can be seen that for the classic GP model the total cost is increased in comparison with the basic energy and environmental models. The reason for this can be attributed to the relaxation regarding the success of the targets for each criterion.
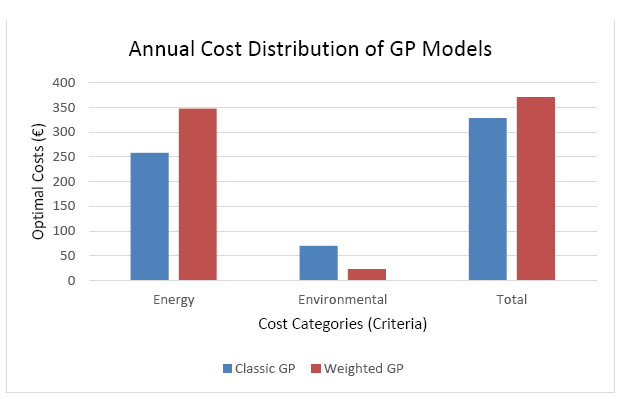
Figure 8 Annual minimized cost distribution for the GP models.
In addition to the above, it is crucial to present the rates of operational time distribution for each energy system used. Figure 9 shows this time distribution on an annual basis for the classic GP model and the energy model excluding the biomass boiler. Thus, for the classic GP model, it is observed that the only energy systems participating are the heat pump and the solar thermal system, with the last considered as more beneficial. This emerges a contrast to the results of the energy model because of the increased participation rate of RES systems in the GP model.
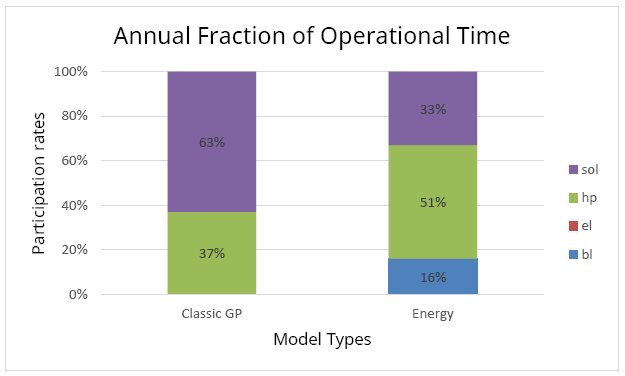
Figure 9 The annual fraction of the operational time for each energy system for the classic GP and the energy (excluding wd, only for climatic zone D) models.
As for the weighted GP model, the results are approximately similar to the classic ones, and in comparison, with the multi criteria 70%–30% model, it could be seen that the participation of the most financial and environmental efficient technologies are beneficial (sol and hp).
The application of optimization algorithms in the design of multi energy systems provides, on one hand, the possibility of in-depth analysis of the parameters of the energy and environmental problem, and, on the other hand, the possibility of evaluating the results towards the limitation of conventional energy sources, according to the suggestions of the calculated rates of participation. The elaboration of a methodology for decision making on energy systems, in combination with the use of a rather small-time step, in terms of energy design, that of one hour, provides a dynamic character to the problem.
According to the present case study for the domestic water heating in a household, in terms of the energy criterion, the optimal energy system is the biomass boiler (or the heat pump for models excluding the biomass), while on an environmental level, the solar thermal system increases its participation. Furthermore, when the GP models involve both energy and environmental criteria, due to potential relaxation from the primary goals, the participation of RES, i.e., solar thermal system, increases.
Further research may focus on utilizing a larger range of mathematical programming models and methods, as well as on problem solving with a shorter time step. The time step decrease may change the design problem to a controlling problem. Moreover, a Life Cycle Assessment (LCA) analysis would enrich the environmental model, allowing a more complete and accurate evaluation of the environmental impact of each energy system. The investigation could also be extended to different types of energy systems, as well as of buildings, including all climatic zones; the uses can also be extended, referring to space heating and cooling.
Not applicable.
Not applicable.
Not applicable.
This research was not funded.
The authors have declared that no competing interests exist.
VK conducted the simulation analysis and was in charge of writing the article. NP supervised the Mathematical Programming section and reviewed the manuscript. GP directed the research and reviewed the manuscript.
| 1. | Eurostat, 2021. Statistics explained – Energy statistics – an overview. 2019 Access on 27 September 2021. Available from: https://ec.europa.eu/eurostat/statistics-explained/index.php?title=Energy_statistics_-_an_overview#Primary_energy_production. |
| 2. | EU, 2002. Directive 2002/91/EP of the European Parliament and of the Council of 16th December 2002 on the energy performance of buildings. Brussels. |
| 3. | EU, 2018. Directive 2018/844/EP of the European Parliament and of the Council of 30th May 2018 amending Directive 2010/31/EU on the energy performance of buildings and Directive 2012/27/EU on energy efficiency. Brussels. |
| 4. | European Commission. Communication from the Commission to the European Parliament, the Council, the European Economic and Social Committee and the Committee of the regions. A policy framework for climate and energy in the period from 2020 to 2030. Brussels. 2014. [Google Scholar] |
| 5. | Pezzutto S, Croce S, Zambotti S, Kranzl L, Novelli A, Zambelli P. Assessment of the Space Heating and Domestic Hot Water Market in Europe — Open Data and Results. Energies. 2019;12:1760. [Google Scholar] [CrossRef] |
| 6. | Fuentes E, Arce L, Salom J. A review of domestic hot water consumption profiles for application in systems and buildings energy performance analysis. Renew Sust Energ Rev. 2018;81:1530-1547. [Google Scholar] [CrossRef] |
| 7. | Tumanova K, Borodinecs A, Geikins A. The analysis of the hot water consumption and energy performance before and after renovation in multi-apartment buildings. IOP CONF SER-MAT SCI. 2017;251:012058. [Google Scholar] [CrossRef] |
| 8. | Eurostat, 2021. Energy Balance Sheets 2019. Access on 27 September 2021. Available from: https://ec.europa.eu/eurostat/statistics-explained/index.php?title=Energy_consumption_in_households#Energy_consumption_in_households_by_type_of_end-use. |
| 9. | Manwell JF, Cleveland CJ. Hybrid energy systems - Encyclopedia of energy. London, UK: Elsevier; 2004. p.215-229. |
| 10. | Ooka R, Komamura K. Optimal design method for building energy systems using genetic algorithms. Build. Environ. 2009;44:1538-1544. [Google Scholar] [CrossRef] |
| 11. | Fabrizio Ε, Corrado V, Filippi Μ. A model to design and optimize multi-energy systems in buildings at the design concept stage. Renew Energ. 2010;35:644-655. [Google Scholar] [CrossRef] |
| 12. | Pierluigi M. MES (multi-energy systems): An overview of concepts and evaluation models. Energy. 2014;65:1-17. [Google Scholar] [CrossRef] |
| 13. | Bayod-Rújula AA, Yuan Y, Martínez-Gracia A, Wang J, Uche J, Chen H. Modelling and simulation of a building energy hub. Proceedings 2018.;2:1431. [Google Scholar] [CrossRef] |
| 14. | Shuangjun X, Chengchu Y, Chen J. Design optimization of hybrid renewable energy systems for sustainable building development based on energy-hub. Energy Procedia. 2019;158:1015-1020. [Google Scholar] [CrossRef] |
| 15. | Ha T, Zhang Y, Thang VV, Huang J. Energy hub modeling to minimize residential energy costs considering solar energy and BESS. J Mod Power Syst Clean Energy. 2017;5:389-399. [Google Scholar] [CrossRef] |
| 16. | Martinopoulos G, Papakostas K, Papadopoulos A. Comparative analysis of various heating systems for residential buildings in Mediterranean climate. Energy Build. 2016;124:79-87. [Google Scholar] [CrossRef] |
| 17. | Martinopoulos G, Papakostas K, Papadopoulos A. A comparative review of heating systems in EU countries, based on efficiency and fuel cost. Renew Sustain Energy Rev. 2018;90:687-699. [Google Scholar] [CrossRef] |
| 18. | Panagiotidou M, Aye L, Rismanchi B. Optimisation of multi-residential building retrofit, cost-optimal and net-zero emission targets. Energy Build. 2021;252:111385. [Google Scholar] [CrossRef] |
| 19. | Gaglia A, Dialynas E, Argiriou A, Kostopoulou E, Tsiamitros D, Stimoniaris D, Laskos K. Energy performance of European residential buildings: Energy use, technical and environmental characteristics of the Greek residential sector – energy conservation and CO₂ reduction. Energy Build. 2019;183:86-104. [Google Scholar] [CrossRef] |
| 20. | TEE. Technical Directive of the Technical Chamber of Greece (TEE) 20701-1: Analytical technical specifications of parameters for the calculation of buildings’ energy performance and the issuing of energy performance certificate. Athens, Greece: TEE; 2017. |
| 21. | TEE. Technical Directive of the Technical Chamber of Greece (TEE) 20701-3: Climatic Data for Greek Areas. Athens, Greece: TEE; 2017. |
| 22. | Mouzeviris G, Papakostas Κ. Comparative analysis of air-to-water and ground source heat pumps performances. Int J Sustain. 2021;40:69-84. [Google Scholar] [CrossRef] |

![]()
Copyright © 2026 Pivot Science Publications Corp. - unless otherwise stated | Terms and Conditions | Privacy Policy


