
Green Energy and Sustainability ISSN 2771-1641
Green Energy and Sustainability 2022;2(1):0001 | https://doi.org/10.47248/ges2202010001
Original Research Open Access
Development of a computational tool for the design of seawater reverse osmosis desalination systems powered by photovoltaics for crop irrigation
Christos-Spyridon Karavas
1
 ,
Evangelos Dimitriou
1
,
Athanasios T. Balafoutis
2
,
Dimitris Manolakos
1
,
George Papadakis
1
,
Evangelos Dimitriou
1
,
Athanasios T. Balafoutis
2
,
Dimitris Manolakos
1
,
George Papadakis
1
Correspondence: Christos-Spyridon Karavas
Academic Editor(s): Thomas Kotsopoulos, Georgios Martinopoulos, Giorgos Panaras
Received: Sep 30, 2021 | Accepted: Nov 29, 2021 | Published: Jan 20, 2022
This article belongs to the Special Issue Selected Papers from the 12th National Conference of IHT
© 2022 by the author(s). This is an Open Access article distributed under the terms of the Creative Commons License Attribution 4.0 International (CC BY 4.0), which permits unrestricted use, distribution, and reproduction in any medium or format, provided the original work is correctly credited.
Cite this article: Karavas C, Dimitriou E, Balafoutis A, Manolakos D, Papadakis G. Development of a computational tool for the design of seawater reverse osmosis desalination systems powered by photovoltaics for crop irrigation. Green Energy Sustain 2022; 2(1):0001. https://doi.org/10.47248/ges2202010001
Access to fresh water is a major human right as mankind existence depends on it. The balance between fresh water supply and actual water demand for agricultural purposes (irrigation) relies on the availability of fresh water in the underground aquifers or surface water resources. Water resources are under great pressure due to the high demand for irrigation to sustain crop productivity and cover domestic use as a result of demographic growth. Desalination of sea or brackish water is one of the solutions to provide water for irrigation in remote areas of limited freshwater reserves. In such areas, if desalination is powered by renewable energy sources, then it can become a lot more sustainable. This paper presents the development of an innovative computational tool for the optimal (economically and technically) design of seawater reverse osmosis desalination systems for sustainable water production for crop irrigation. In order to further reduce the cost of water produced, an energy management and control system was also designed and included in the computational tool to ensure the optimal operation of the desalination plant. This system allows the seawater reverse osmosis unit to operate at variable load and determines its optimal operation point using computational intelligence techniques based on fuzzy cognitive maps. According to the results, the implementation of the computational tool for the design of PV-SWRO system presents the lowest cost as compared to the system designed with the conventional methodology.
KeywordsRO desalination, PV systems, Computational intelligence
World population, according to United Nations Organization, exceeded 7.4 billion in 2016, while it is projected to reach 11.2 billion until 2100. Today, about 85% of the available freshwater resources worldwide are used in agriculture and this percentage is expected to continue dominating water consumption due to the increase of population [1]. Agriculture in semi-arid and arid regions is highly dependent on available water for irrigation [2]. The lack of fresh water in these areas has led to increased use of low quality and brackish groundwater [3]. The salinity of irrigation water is known to adversely affect both crop growth and yields [4]. Therefore, appropriate irrigation water management system is required to maintain the appropriate salinity level for irrigation, as high salinity leads to osmotic stress that reduces water intake and suppresses plant growth [5]. The use of desalinated water is a long-term sustainable irrigation strategy [6]. The replacement of the high salt water with clean water improves the crop production efficiencies and at the same time reduces irrigation requirements, without adverse local environmental impacts [7].
The main desalination method, which is known and widely used today is the reverse osmosis (RO) desalination [8]. RO is a process in which the feed water enters a semipermeable membrane at a pressure greater than the osmotic and the membrane separates the fresh water from the concentrate solution. In addition, sea water reverse osmosis (SWRO) desalination is, by far, the predominant desalination technique today [9]. SWRO desalination is a process of high energy consumption due to the high pressure required to produce fresh water [10]. The continuing rise in fossil fuel prices and their impact on the environment, combined with the advantages of Renewable Energy Sources (RES), makes the use of RES desalination units as most attractive, reliable, and environmentally friendly solution for production of fresh water. Therefore, RO desalination systems combined with RES can lead to the economic and social development of areas that lack fresh water for both drinking and irrigation [11]. It is estimated that the countries in the Middle East and North Africa regions will cover more than 22% of their freshwater demand through solar powered desalination by 2050 [12].
In the literature, several RO desalination plants powered by RES (such as photovoltaics or wind turbines) have been studied and proposed [13,14]. However, the energy production by RES is variable and intermittent since the electricity generation is based on the weather conditions. If we consider that SWRO desalination equipped with energy recovery and powered by RES, may present lower specific energy consumption (kWh per m3 of produced fresh water) under variable pressure and flowrate of feed water compared with its operation at nominal load [15,16], it is vital to achieve optimal design of such desalination plant, by selecting the optimal size of all individual sub-systems and components, aiming at minimal cost while preserving the system reliability.
The design process of desalination systems powered by RES and specifically Photovoltaics (PVs) is usually carried out in two separate steps; the first step involves the design of the desalination system, based on the required water demand profile and an assumption about the capacity factor of the desalination unit (average number of operating hours per day), while the second step involves the design of the PV system, based on the energy needs for the desalination plant designed in the first step.
In the first step, usually commercial software tools such as ROSA, IMSDesign or Q+ Projection Software, are used for the design of RO system. These commercial programs do not allow a flexible design as they do not allow the user to change the commercial packages that have been established by the membrane manufacturers. This forces the user to test different configurations in order to define the system with the desired realistic operating conditions and this trial and-error approach results in a waste of time for the designer [17]. Therefore, in the first step a power profile is created, which is used as an input in the second step for the design of the RES system. Several commercial software has been developed for the optimum technical and economical designing (proper sizing) of renewable energy systems such as HOMER, RETScreen, Hybrid2 and iHOGA [18]. The above method which includes the use of two software tools; one commercial tool for the design of RO system and one for the design of RES system, leads to non-optimized (over-sized) systems which in most cases makes the installation cost high [19] and the desalinated water more expensive than water from other origins [20]. In contrast, taking into consideration that the total global food production will increase about 70% by 2050 and due to climate change (water scarcity) and increased agricultural withdrawals, the irrigation water costs will increase by 66% [21], it turns out that the RE-based SWRO desalination will offer a steady and cost-effective water supply [22]. Therefore, the deficiencies in commercial software tools for the design of RO systems powered by RES, motivate the development of new ones that allow the flexible design of RE powered SWRO systems and will incorporate new procedures for the optimum sizing of these systems.
The present work aims to intends to overcome the aforementioned research gaps by designing and proposing an integrated water management system for irrigation, using SWRO desalination powered by PVs that is controlled by a computational tool incorporating algorithms which allow the SWRO unit to operate at variable load and determines its optimal operation point according to the instantaneous PV power available using computational intelligence techniques based on Fuzzy Cognitive Maps, without affecting the crops growth and quality. Therefore, a new computational tool has been designed and developed, which make use of the simultaneous optimization of the sizing of the components of the water management system, and present financial and operational benefits than the widely conventional used practices. The results of this study will contribute to viable agricultural development of semi-arid and arid areas, as it aims to minimize the freshwater production cost for irrigation in a sustainable and efficient way.
The structure of this paper is consisted of the current section (Introduction), followed by Section 2, where preliminary experimental results related to a SWRO desalination unit operating at variable load conditions and an experimental study of lettuce irrigation under different salinity levels are presented. Section 3 describes the design of the computational tool that is used for the optimal design of desalination systems with PVs for lettuce irrigation purposes. Results from the testing of the computational tool are reported and discussed in Section 4, while Section 5 summarizes the conclusions of the present study.
The variable load operation of SWRO units results in lower specific energy consumption. However, variable operation of a SWRO unit (variable feed flow rate and pressure) affects the flow rate and the electrical conductivity (salinity) of the produced fresh water. Particularly, when the high-pressure pump of a SWRO unit is supplied by lower power than the nominal one, then the membrane inlet pressure is decreased and as a result the product flow rate is decreased while the salinity of the desalinated water is increased [15,16]. In order to determine the specific energy consumption and the product conductivity as functions of membrane inlet pressure, a SWRO desalination unit was initially studied individually identifying its performance at variable load operation.
The Sea water Reverse Osmosis desalination system (Figure 1) includes a high-pressure pump equipped with two types of Danfoss pumps, coupled with a DC electrical motor and a DC driver for the control speed of the motor responsible for the control speed of the rotational speed of the motor pump assembly. Additionally, the SWRO system is equipped with a feed water pump, a pretreatment system, four membrane modules, a mixing tank and measurement instruments (flow meters, pressure, and electrical conductivity transmitters). The SWRO desalination system has been discussed in detail in [16]. The main technical specifications of the SWRO desalination unit, are shown in Table 1.

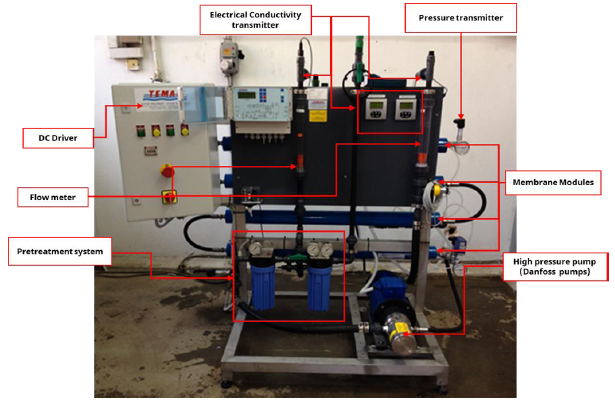
Figure 1 Reverse Osmosis desalination unit.
Table 1 Technical specifications of the SWRO system.

Regarding irrigated fresh vegetables, lettuce (Lactuca sativa) is categorized as being moderately salt tolerant [23]; on account of this, an experimental study of lettuce irrigation was executed to study the growth rate, the quality characteristics, and the yield under six different salinity levels of irrigation water as would be the case if water is produced by a desalination plant that operates at variable load. Hence, the objective of the experimental study is to identify the impact of water salinity on lettuce yield/quality, in order to determine the SWRO unit operation limits for the production of adequate water quality, while operating under variable load conditions with the least energy consumption for irrigation purposes.
The experimental study of lettuce irrigation was executed to assess the response of lettuce under different salinity levels of irrigation water by evaluating the growth rate, the quality characteristics, and the yield. The water was stored in six different water tanks according to each water salinity level (300, 800, 1200, 1700, 2200 and 3000 μS/cm). The crop irrigation experiment was conducted in spring 2020 in a glasshouse at the Agricultural University of Athens (N 37°59′10″, E 23°42′29″, altitude 24 m). On February 24th, 2020, lettuce (Lactuca sativa) seedlings at the stage of three true leaves were transplanted in 4 L pots filled with sandy soil as a substrate. The characteristics of soil are presented in Table 2.
Table 2 Soil characteristics.
Twelve plants were accommodated in an irrigation channel with the dimensions of 5.3 m in length, 0.42 m in width, and 0.07 m in height and supporting on scaffoldings with 4% inclination. The total irrigation channels were six as the different salinities of the irrigation water produced by the SWRO system. The plants into the irrigation channels are presented graphically in Figure 2a. For the identification of the plants level alphabetic letters were used in each salinity level. Three from twelve plants in each salinity level were used for the experimental measurements (height, diameter and dry biomass) and they are depicted in Figure 2a with green color.
The plants treated with a conventional basic nutrient solution (N:12%, P2O5:8%, K2O:16%). The optimum fertilization rate was set to 12 grams of each pot as reference [24]. The experimental layout is shown graphically in Figure 2a. Each salinity level was divided in twelve samples. Alphabetic letters were used for the identifications of the samples in each salinity level. The samples with green color (sub-samples) were used for the experimental measurements. Irrigation flow was set at 32 mL/min*pot and irrigation time was set to 3 min/2 times per day (morning and afternoon). Lettuce plants were grown under natural light conditions. Inside the glasshouse, the daily air temperature was always maintained below 25 °C, while the night temperature was always higher than 12 °C. A perspective of crop irrigation experiment in the glasshouse is presented in Figure 2b.
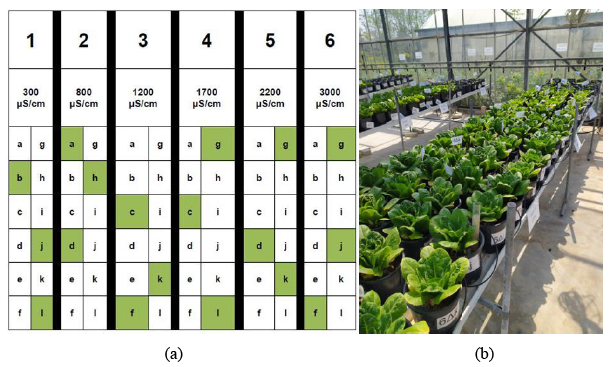
Figure 2 (a) The experimental layout of lettuce cultivation; (b) Lettuce irrigation experiment in the glasshouse.
The Fuzzy Cognitive Maps (FCM) constitutes a modeling methodology based on human knowledge and belongs to the category of computational intelligence methods. The Fuzzy Cognitive Maps have been introduced by Kosko [25] and have been widely used in complex nonlinear systems containing uncertainties [26]. FCMs consist of nodes (Ci), which can be inputs, outputs, rules or intermediate states and each concept is characterized by a value (Ai) in the space [0, 1]. Each node can interact with other nodes. The relationship between the nodes is expressed by weights which take values in a range between [−1, 1]. The definition of the model nodes and the degree and type of the interaction between them can be determined by the knowledge of the experts. The FCM theory has been discussed in detail in [17, 24].
A typical FCM is depicted in Figure 3 where Ci represents the nodes-concepts and the weights (wij) express their relationships.

Figure 3 Structure of a typical FCM.
The weights of an FCM can be presented in a matrix form (Wi,j), as follows:
The values of the FCM nodes are calculated according to Eq. 1.
Optimization methods aims to define the optimal solution of an objective function, considering the constraints and restrictions of the optimization problem. Several optimization algorithms have been proposed for engineering problems in the literature [27]. Indicatively, heuristic techniques such as Genetic Algorithms, Simulated Annealing, Particle Swarm Optimization (PSO) and Ant Colony Optimization, are used to solve complex multi-dimensional optimization problems [28]. In the present paper, the PSO method was used to find the optimum sizing of the components of the PV-SWRO system. The PSO method is a stochastic optimization, evolutionary and simulating algorithm and its purpose is to find the optimum solution of an objective function by performing a stochastic search based on a population. PSO has been used because of the good results it has produced in energy systems optimizations [19,29,30]. The used PSO settings are presented in Table 3 [31].
Table 3 PSO settings.
The proposed tool is a computational tool for optimal design of desalination systems powered by PVs for crop irrigation. The computational tool targets at the optimization of both desalination unit and RES, together with the coordination of the control system. In order to find the most cost-effective system that meets the demand for irrigation water at the lowest possible cost, the computational tool carries out technical and economic optimization of the following variables:
Number of membranes connected in series and in parallel.
Number of membrane cases connected in series and in parallel.
Technical characteristics of the energy recovery device in the RO unit.
Choice of control strategy (full load or variable load).
Number of PV panels.
Number of batteries connected in series and in parallel.
Size of the water tank.
The design after the optimization will lead to systems that provide lower water cost and improved operational efficiency.
Initially, a database was created, which includes SWRO desalination systems for production capacity of 50 m3 per day to 300 m3 per day. An important element for the optimal desalination system, according to the desired water production, is the composition of the feed solution (salt water). Thus, the optimal desalination system is determined by the quality of the feed water (total amount of solid particles, in mg per L of water - Total Dissolved Solids (TDS)). A desalination system, for a specific water production, can be designed by selecting the type and the number of membranes, their arrangement, the number of membrane cases and the number of desalination stages. The optimal desalination system will be the system with the lowest energy requirements per unit of amount of desalinated water produced (kWh/m3). For the creation of the database the software package SQL Server Management Studio was used [32].
Weather is an important factor in agricultural production, as it has a significant impact on crop growth, their water needs, their fertilizer requirements as well as on their yield. Weather changes can cause damages to crop, produce soil erosion, and affect crop quality. In addition, weather conditions are the main factor in predicting the energy production from PV panels. Therefore, a weather forecasting algorithm was developed, based on machine learning, with the use of time series and specifically the ARIMA model [33]. The main variables that must be forecasted are solar radiation, relative humidity, wind speed, duration of rainfall and ambient temperature. A short-term (3 days) weather forecast algorithm was developed using the Python programming language [34].
An energy management and control system for the desalination unit was developed to determine the optimal operating point of the desalination unit, based on techniques of computational intelligence, particularly on Fuzzy Cognitive Maps. This system was integrated into the computational tool, providing more flexibility for the designer to choose between two options:
(a) the system where the desalination plant operates at its rated load and (b) the system where the desalination plant operates at variable load [29,30,35].
The logical diagram of the energy management and control system is presented in Figure 4. The inputs for the energy management and control system are the water tank level (Wlevel(t)), the state of charge the batteries (SOC) and the energy produced by the photovoltaic panels (PVpower). If the water tank level is equal to the maximum value (Wmax) or the SOC of the batteries is less or equal to 20% (minimum SOC for the batteries) then the operating point of the desalination unit (C4) is set to zero. In all other cases, the energy management and control system use a fuzzy cognitive map (FCM) to decide the operating point of the desalination plant (C4), taking as concepts the stored water in the water tank (C1), the SOC of batteries (C2), and the energy production by PVs (C3). All concepts are fuzzified in the space [0, 1]. Using the centroid defuzzification method, the concept of the operation point of the desalination unit (C4), takes a numerical value. This value is a percentage of the nominal power of the desalination unit. The weights Wij express the relationship between the concepts and their values in space [0, 1]. The design and the programming of the energy management and control system were implemented using the MATLAB software package.

Figure 4 Logical diagram of the energy management and control system.
The optimization aims to minimize the net present cost (NPC) of the PV-SWRO system for a 20-year investment. Hence, a cost function was formulated, and it is presented in Eq. 2.
where nPV is the number of the installed PV modules, PPV is the rated power of the PV modules (W), CostPV is the price of the PV modules (€/W), Ebat is the battery bank’s rated energy capacity, Costbat is the price of the battery bank (€/kWh), Cdes is the capacity of the desalination unit (m3/h), Costdes is the cost of the desalination unit (€), Costele is the cost of electronics (€), R is the annuity factor equal to 8%, Cins,PV is the insurance cost of the PVs (€), Cmain is the maintenance costs (€), Cchem,des is the chemicals costs (€/m3), j is the annual increase of prices at 1%, Pi is the annual fresh water production (m3), and i is the interest rate was equal to 5%.
The overall system cost analysis of the 20-year investment is presented in Table 4. The prices of the equipment are in accordance with the market prices [19].
Table 4 Costs and lifetime of the PV-SWRO components.
The environment of the computational tool was modelled and implemented using three existing software packages. The main software used is TRNSYS. TRNSYS is a flexible software environment used to simulate the behavior of transient systems and is a dynamic simulation software for energy systems. In addition to TRNSYS library, which includes various subroutines for photovoltaics, and batteries, the user can include tailored made subroutines (e.g., desalination system, controllers, etc.) in FORTRAN. Based on its modular structure, it can solve large groups of equations described by the various subroutines. GenOpt is open-source optimization software that allows multidimensional optimization of an objective function calculated by a simulation program. It is a standalone platform written in java that can minimize a cost function evaluated by an external simulation program such as TRNSYS and can be successfully connected with TRNSYS. GenOpt has been developed for optimization problems where the cost function is computationally accurate, and its derivatives are not available or may be not yet exist. TRNOPT software was used to connect GenOpt to TRNSYS. The TRNOPT transmits data from TRNSYS to GenOpt and vice versa without any interaction from the user. Finally, Matlab software was used for the development of the energy management system and control system. MATLAB is a high-level language and an interactive environment for arithmetic calculations and programming. The structure of the modelling and simulation framework of the computational tool is shown in Figure 5.
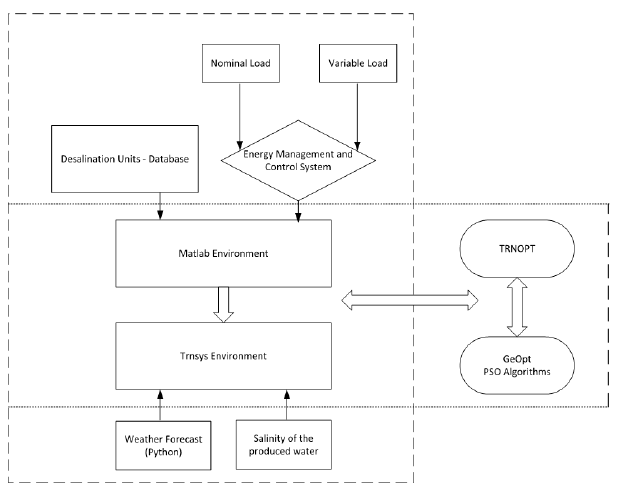
Figure 5 Schematic of the computational tool.
The SWRO desalination unit was initially studied to identify its performance at variable load conditions (variable pressure and variable feed water supply) by varying the power input, in order to determine its optimum operational window with the lowest specific energy consumption. The specific energy consumption and the electrical conductivity of the produced water as a function of the membrane inlet pressure of the desalination unit, are presented in Figure 6. The specific energy consumption (kWh/m3) is calculated as the ratio of the energy consumed by the SWRO motor (kWh) to the freshwater production (m3). The experimental results showed that the SWRO desalination unit can operate in a range of conductivity within the optimum operational window in which the SEC is around 5 kWh/m3.
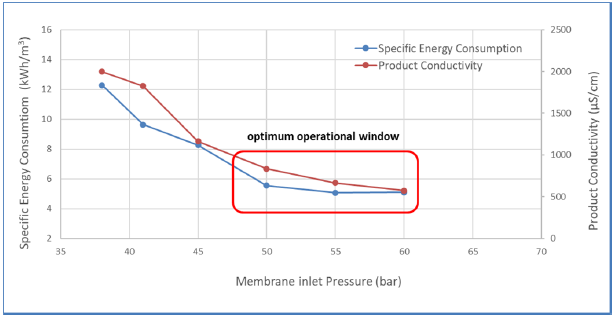
Figure 6 Specific energy consumption and electrical conductivity as a function of the membrane inlet pressure.
The height and diameter of canopy were measured every three days during the growing period, in order to identify the impact of irrigation water salinity on lettuce yield/quality. The experimental results with regard to lettuce height and diameter, under different salinity levels are presented in Figures 7 and 8, respectively. The experimental measurements showed that the maximum height was noticed for the salinity of 300 μS/cm at 25 cm whereas the minimum height was for the salinity of 2200 μS/cm at 19 cm (Figure 6). The same situation was observed in the experimental results of diameter with the maximum rate at 27 cm for the salinity of 1700 μS/cm and the minimum at 25.3cm for the salinity of 2200 μS/cm (Figure 7).
The experimental measurements showed that, the lettuce height under the salinity levels of 800–3000 μS/cm was lower than the lettuce height under the reference salinity point of 273 μS/cm and the best height was noticed in the salinities 800, 1200 and 1700 μS/cm (Figure 7). The opposite situation was observed in the experimental results of diameter (Figure 8) where the lettuce leaves at the reference salinity point of 273 μS/cm had lower dimensions than the lettuce leaves at the salinity levels of 800–3000 μS/cm while the best dimeter was noticed in the salinities 800, 1200 and 1700 μS/cm. Additionally, the dry biomass of lettuce leaves was also measured, the results of which, are presented in Figure 9. Specifically, Figure 9 shows the weight of dry biomass of lettuce canopy in different salinity levels. It was observed that the maximum weight of dry biomass of lettuce canopy was for the salinity of 300 μS/cm and the rest salinities had approximately the same weight of dry biomass with the reference salinity point (273 μS/cm). However, as it can be noticed in Figures 6–8 there aren’t any significant difference during the lettuce growth between the 6 salinity levels. This was validated through the analysis of variance (one way-ANOVA) which was caried out using the software package Statistica for Windows 9.0 (Tulsa, OK, USA). Hence, the best salinities level for lettuce irrigation purposes and simultaneously with the least energy consumption for the desalinated water by a PV-SWRO system are 300, 800 and 1200 μS/cm with specific energy consumption of around 5 kWh/m3.
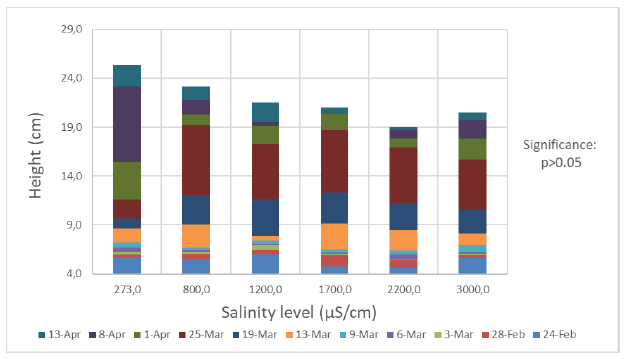
Figure 7 The growing rate of lettuce height in different salinity levels.
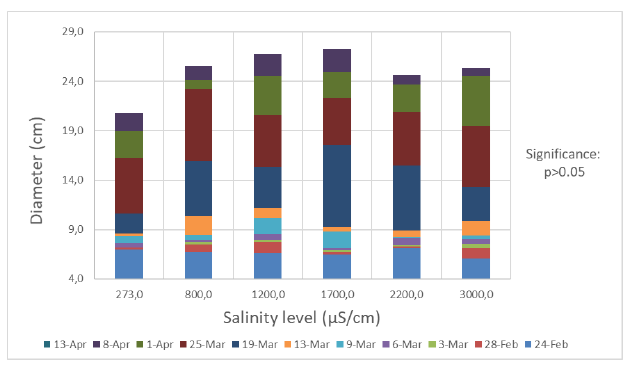
Figure 8 The growing rate of lettuce diameter in different salinity levels.
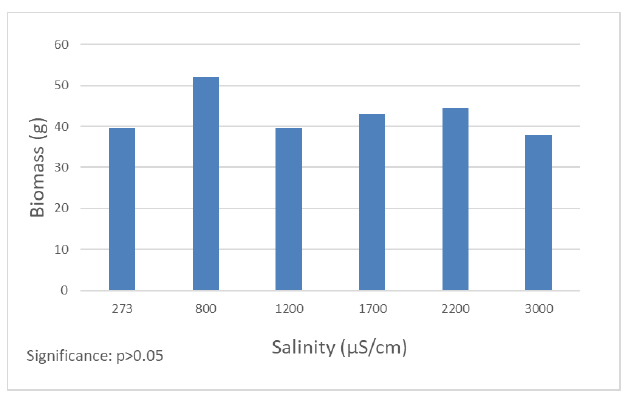
Figure 9 The weight of dry biomass of lettuce canopy in different salinity.
In order to evaluate the computational tool, a case study was conducted that includes a SWRO desalination system powered by PVs for lettuce irrigation. The PV-SWRO desalination system was considered to be installed in an Aegean Island, namely Naxos, at Cyclades complex, to irrigate a 0.1 ha lettuce farm. Given that the Aegean islands are characterized by high solar and wind potential, the combination of RES with SWRO desalination units is the most appropriate way to address water issues for crop irrigation on these islands. Specifically, lettuce is a cool-season crop and the optimal temperatures for its growth are 23 oC during day and 7 oC at night [36]. The solar radiation and the temperature per month for the selected area is presented in Figure 10.
The amount of irrigation water depends on biotic (fungi etc.) and abiotic factors (temperature, type of soil, its season year and soil moisture). The water requirements of a lettuce crop are usually 340 to 750 m3 per ha and the growing season is from September to April [36,37]. This high range of irrigation rate, together with the irrigation experience in Naxos Island (private communication with farmers) were used to identify the average consumption presented in Figure 11 for the 0.1 ha land under consideration. In this case study scenario, the water requirement is presented on a monthly basis in Figure 11 [38,39] in order to prevent water stress. In addition, it was considered that a drip irrigation system was installed for lettuce irrigation as drip irrigation transfers small amounts of water to the periphery of the roots of plants and as a result it can save water and increase crop production [40,41]. The rest of the period, the PV-SWRO unit can be used to produce water for other purposes.
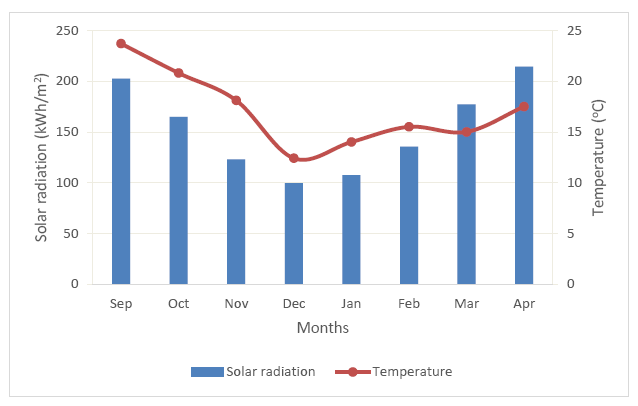
Figure 10 The solar radiation and temperature per month
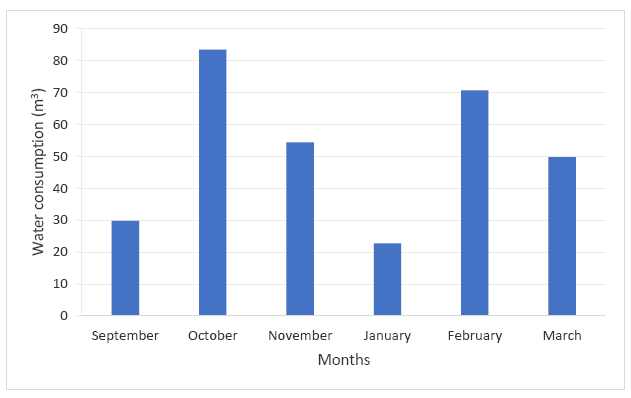
Figure 11 Daily water consumption for irrigation per month.
The PV-SWRO system must cover specific technical constraints in order to ensure its stability and safe operation. The technical constraints used are:
The water needs for irrigation should be covered at 100% throughout the year.
The water tank size should never get empty, and the minimum stored water should be sufficient to cover the water needs for 2 days of irrigation.
The amount of stored water in the water tank at the end of the year, must be equal or more than its initial value, so that the continuous operation of the system will be ensured annually.
The minimum SOC of the batteries is set at 20 % and hence, the SOC should not drop under this limit at any time.
The salinity of the produced water should not exceed 1200 μS/cm, since the experimental results of the SWRO unit in Subsection 4.1 and the statistical analysis in Subsection 4.2, showed that there is non-statistical difference between salinities on the lettuce growth for salinities below 1200 μS/cm while the SWRO unit presents low specific energy consumption in this operational window.
The results of the application of the computational tool are presented in Table 5. It can be observed that a PV powered SWRO desalination system that operates at variable load and combined with a small capacity battery bank and an energy management and control system based on fuzzy cognitive maps, is the optimum system since this system can ensure the required water production for irrigation needs at lowest cost compared with the system that computed with the conventional way of design, covering in parallel all the technical set constraints.
Table 5 Computational tool results compared with a conventional design.
In addition, the operation of the PV-SWRO desalination unit under variable load can further reduce the NPC. Specifically, the PV-SWRO desalination system, operating only at nominal load, designed by the computational tool presented lower NPC by almost 25% compared to the conventional way of designing, and the PV-SWRO desalination system that operated at variable load presented lower NPC by almost 39% compared to the conventional method of designing.
The design process followed to date for a SWRO desalination system powered by RES, is complex and time consuming and often leads to non-optimized high-cost systems. The software programs for the design of SWRO desalination systems, which are commercially available from various membrane manufacturers, are used only for sizing the desalination units, while for the design of the RES system a different calculation tool is usually used, taking as input data the results from the design tool of the RO unit.
The present paper presents the development of a new innovative software tool for the optimum design of integrated SWRO systems powered by PVs able to meet water requirements for crop irrigation (production of suitable water salinity for crop irrigation). The new computational tool presents significant advantages over existing commercially available software programs, as the optimal design results from the simultaneous optimization of the sizes of both the desalination unit and the PV system. The innovative computational tool also includes an advanced system for the energy management and the control of the PV-SWRO desalination plant, based on Fuzzy Cognitive Maps, and a prediction algorithm based on machine learning techniques in order to maximize the performance of the designed system and to ensure the optimal operation of the desalination unit. The results showed that the system calculated by the innovative computational tool utilizes the available devices better, which in turn led to considerably lower cost than the widely conventional used practices for the design of PV-SWRO systems.
The innovative tool is expected to create additional positive effects on the economy and society as it offers an interconnection between the water and energy sector, increases farmers’ participation in the water management and energy saving, and provides satisfaction to farmers due to lower cost of irrigation water.
Not applicable.
Not applicable.
Not applicable.
This experimental work is co-financed by Greece and the European Union (European Social FundESF) through the Operational Program «Human Resources Development, Education and Lifelong Learning 2014-2020» and the Program encoded EDBM103, titled “Support for researchers with an emphasis on young researchers-cycle B’”, in the context of the project “Development and validation of a computational tool for designing RO-PV desalination systems for irrigation” (MIS 5048478).
George Papadakis is Editor-in-Chief of the journal Green Energy and Sustainability. All the authors have declared that no competing interests exist. The authors were not involved in the journal’s review or decisions related to this manuscript.
| 1. | Drechsel P, Danso G, Qadir M. Wastewater use in agriculture: challenges in assessing costs and benefits. In: Drechsel P, Qadir M, Wichelns D, editor. Wastewater. Dordrecht: Springer; 2015. p.139-152. [Google Scholar] [CrossRef] |
| 2. | Schacht K, Chen Y, Tarchitzky J, Marschner B. The use of treated wastewater for irrigation as a component of integrated water resources management: reducing environmental implications on soil and groundwater by evaluating site-specific soil sensitivities. In: Borchardt D, Bogardi J, Ibisch R, editor. Integrated Water Resources Management: Concept, Research and Implementation. Cham: Springer; 2016. p.459-470. [Google Scholar] [CrossRef] |
| 3. | Wada Y, van Beek LPH, Bierkens MFP. Nonsustainable groundwater sustaining irrigation: A global assessment. Water Resour Res 2012;48(6). [Google Scholar] [CrossRef] |
| 4. | Ayers RS, Westcot DW. Water quality for agriculture. FAO Irrigation and Drainage Paper 29. Rome: FAO; 1985. [Google Scholar] |
| 5. | Grattan S. Irrigation Water Salinity and Crop Production. Oakland: University of California, Agriculture and Natural Resources; 2002. [Google Scholar] |
| 6. | Yermiyahu U, Tal A, Ben-Gal A, Bar-Tal A, Tarchitzky J, Lahav O. Rethinking desalinated water quality and agriculture. Science 2007;318:920-921. [Google Scholar] [CrossRef] |
| 7. | Martínez-Alvarez V, Martin-Gorriz B, Soto-García M. Seawater desalination for crop irrigation—A review of current experiences and revealed key issues. Desalination 2016;381:58-70. [Google Scholar] [CrossRef] |
| 8. | Lee KP, Arnot TC, Mattia D. A review of reverse osmosis membrane materials for desalination—development to date and future potential. J Membrane Sci 2011;370:1-22. [Google Scholar] [CrossRef] |
| 9. | Karavas C-S, Papadakis G. Renewable energy driven small-scale sea water reverse osmosis desalination systems: A survey. J Fundam Renew Energy Appl 2017;7(3). [Google Scholar] [CrossRef] |
| 10. | Greenlee LF, Lawler DF, Freeman BD, Marrot B, Moulin P. Reverse osmosis desalination: Water sources, technology, and today’s challenges. Water Res 2009;43:2317-2348. [Google Scholar] [CrossRef] |
| 11. | Mohamed ES, Papadakis G. Advances of Renewable Energy Powered Desalination. In: Yan J, editor. Handbook of Clean Energy Systems. Hoboken: John Wiley & Sons; 2015. [Google Scholar] [CrossRef] |
| 12. | Droogers P, Immerzeel WW, Terink W, Hoogeveen J, Bierkens MFP, Van Beek LPH, Debele B. Water resources trends in Middle East and North Africa towards 2050. Hydrol Earth Syst Sci 2012;16(9):3101-3114. [Google Scholar] [CrossRef] |
| 13. | Alkaisi A, Mossad R, Sharifian-Barforoush A. A review of the water desalination systems integrated with renewable energy. Energy Procedia 2017;110:268-274. [Google Scholar] [CrossRef] |
| 14. | García-Rodríguez L. Renewable energy applications in desalination: state of the art. Sol Energy 2003;75(5):381-393. [Google Scholar] |
| 15. | Dimitriou E, Mohamed ES, Kyriakarakos G, Papadakis G. Experimental investigation of the performance of a reverse osmosis desalination unit under full- and part-load operation. Desalination Water Treat 2015;12:1-9. [Google Scholar] [CrossRef] |
| 16. | Dimitriou E, Mohamed ES, Karavas C, Papadakis G. Experimental comparison of the performance of two reverse osmosis desalination units equipped with different energy recovery devices. Desalination Water Treat 2015;55:3019-3026. [Google Scholar] [CrossRef] |
| 17. | Ruiz-García A, de la Nuez-Pestana I. A computational tool for designing BWRO systems with spiral wound modules. Desalination 2018;426:69-77. [Google Scholar] [CrossRef] |
| 18. | Sinha S, Chandel S.S. Review of software tools for hybrid renewable energy systems. Renew Sust Energ Rev 2014;320:192-205. [Google Scholar] [CrossRef] |
| 19. | Karavas C-S, Arvanitis KG, Papadakis G. Optimal technical and economic configuration of photovoltaic powered reverse osmosis desalination systems operating in autonomous mode. Desalination 2019;466:97-106. [Google Scholar] [CrossRef] |
| 20. | Zarzo D, Campos E, Terrero P. Spanish experience in desalination for agriculture. Desalination Water Treat 2013;51(1-3):53-66. [Google Scholar] [CrossRef] |
| 21. | Cornish G, Bosworth B, Perry C, Burke J. Annex 1 Water Charging for Irrigation – Data from Literature. Water charging in irrigated Agriculture. Rome: FAO; 2004. [Google Scholar] |
| 22. | Caldera U, Breyer C. Assessing the potential for renewable energy powered desalination for the global irrigation sector. Sci Total Environ 2019;694:133598. [Google Scholar] [CrossRef] |
| 23. | De Pascale S, Barbieri G. Effects of soil salinity from long-term irrigation with saline-sodic water on yield and quality of winter vegetable crops. Sci Hortic 1995;64(3):145-157. [Google Scholar] [CrossRef] |
| 24. | Dewson R. SQL server management studio. Beginning SQL Server 2008 for Developers: From Novice to Professional. Berkeley: Apress; 2008. p.25-50. [Google Scholar] [CrossRef] |
| 25. | Kosko B. Fuzzy cognitive maps. Int J Man-Machine Stud 1986;24(1):65-75. [Google Scholar] |
| 26. | Papageorgiou EI, Salmeron JL. A review of fuzzy cognitive maps research during the last decade. IEEE Trans Fuzzy Syst 2013;21(1):66-79. [Google Scholar] [CrossRef] |
| 27. | Fadaee M, Radzi M. Multi-objective optimization of a stand-alone hybrid renewable energy system by using evolutionary algorithms: A review. Renew Sustain Energy Rev 2012;16:3364-3369. [Google Scholar] [CrossRef] |
| 28. | Hazra J, Sinha AK. Environmental constrained economic dispatch using bacteria foraging optimization. Proceedings of 2008 Joint International Conference on Power System Technology and IEEE Power India Conference; 12-15 Oct 2008; New Delhi, India.. [CrossRef] |
| 29. | Karavas C-S, Kyriakarakos G, Arvanitis KG, Papadakis G. A multi-agent decentralized energy management system based on distributed intelligence for the design and control of autonomous polygeneration microgrids. Energy Convers Manag 2015;103:166-179. [Google Scholar] [CrossRef] |
| 30. | Karavas C-S, Arvanitis K, Papadakis G. A Game Theory Approach to Multi-Agent Decentralized Energy Management of Autonomous Polygeneration Microgrids. Energies 2017;10:1756. [Google Scholar] [CrossRef] |
| 31. | Boglou V, Karavas CS, Karlis A, Arvanitis K. An intelligent decentralized energy management strategy for the optimal electric vehicles’ charging in low‐voltage islanded microgrids. Int J Energy Res 2021. [Google Scholar] [CrossRef] |
| 32. | Karavas C-S, Arvanitis KG, Kyriakarakos G, Piromalis DD, Papadakis G. A novel autonomous PV powered desalination system based on a DC microgrid concept incorporating short-term energy storage. Sol Energy 2018;159:947-961. [Google Scholar] [CrossRef] |
| 33. | Rahman Μ, Islam AS, Nadvi SYM, Rahman RM. Comparative study of ANFIS and ARIMA model for weather forecasting in Dhaka. Proceedings of 2013 International Conference on Informatics, Electronics and Vision (ICIEV); 17-18 May 2013; Dhaka, Bangladesh.. [CrossRef] |
| 34. | Jaihuni M, Basak JK, Khan F, Okyere FG, Arulmozhi E, Bhujel A. A Partially Amended Hybrid Bi-GRU—ARIMA Model (PAHM) for Predicting Solar Irradiance in Short and Very-Short Terms. Energies 2020;13(2):435. [Google Scholar] [CrossRef] |
| 35. | Hu X, Li S, Peng H. A comparative study of equivalent circuit models for Li-ion batteries. J Power Sources 2012;198:359-367. [Google Scholar] [CrossRef] |
| 36. | Turini T, Cahn M, Cantwell M, Jackson L, Koike S, Natwick E. Iceberg lettuce production in California. eScholarship - Open Access Publications from the University of California 2011. [Google Scholar] [CrossRef] |
| 37. | Barbosa GL, Gadelha FDA, Kublik N, Proctor A, Reichelm L, Weissinger E. Comparison of land, water, and energy requirements of lettuce grown using hydroponic vs. conventional agricultural methods. Int J Environ Res Public Health 2015;12(6):6879-6891. [Google Scholar] [CrossRef] |
| 38. | Saner D, Beretta C, Jäggi B, Juraske R, Stoessel F, Hellweg S. FoodPrints of households. Int J Life Cycle Assess 2016;21:654-663. [Google Scholar] [CrossRef] |
| 39. | Martin E, Slack D, Pegelow EJ. Water Use in Vegetables - Western Head Lettuce. Tucson: College of Agriculture and Life Sciences, University of Arizona; 2009. [Google Scholar] |
| 40. | Wilson ML, Rosen CJ, Moncrief JF. Effects of polymer‐coated urea on nitrate leaching and nitrogen uptake by potato. J Environ Qual 2010;39(2):492-499. [Google Scholar] [CrossRef] |
| 41. | Chen Z, Han Y, Ning K, Luo C, Sheng W, Wang S. Assessing the performance of different irrigation systems on lettuce (Lactuca sativa L.) in the greenhouse. PLOS One 2019;14(2):e0209329. [Google Scholar] [CrossRef] |

![]()
Copyright © 2024 Pivot Science Publications Corp. - unless otherwise stated | Terms and Conditions | Privacy Policy


